Data normalization is an essential preprocessing step in data analysis and machine learning. It ensures that the data values are on a similar scale, which improves the performance of models and avoids bias caused by features with larger ranges. There are several advanced techniques for normalizing data, such as Min-Max Scaling, Z-Score Standardization, Robust Scaling, and Log Transformation. Below, I’ll explain each method and provide the VBA code to implement them in Excel.
- Min-Max Scaling
Min-Max scaling transforms the data such that it falls within a specific range, typically between 0 and 1. The formula is:
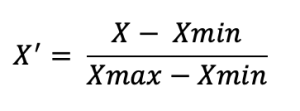
This technique is useful when we want to keep the data within a defined range, especially for algorithms like neural networks.
VBA Implementation for Min-Max Scaling:
Sub MinMaxNormalization()
    Dim ws As Worksheet
    Dim rng As Range
    Dim cell As Range
    Dim MinVal As Double
    Dim MaxVal As Double
    Dim ScaledValue As Double
    ' Set the worksheet and the range of data
    Set ws = ThisWorkbook.Sheets("Sheet1")
    Set rng = ws.Range("A2:A100") ' Modify range accordingly
    ' Find the min and max values in the range
    MinVal = Application.WorksheetFunction.Min(rng)
    MaxVal = Application.WorksheetFunction.Max(rng)
    ' Loop through each cell in the range and apply Min-Max scaling
    For Each cell In rng
        ScaledValue = (cell.Value - MinVal) / (MaxVal - MinVal)
        cell.Offset(0, 1).Value = ScaledValue ' Write the normalized value in the next column
    Next cell
End Sub
Explanation:
- The MinVal and MaxVal are computed using Excel’s Min and Max functions.
- The data is then normalized using the formula and the result is written to the next column (cell.Offset(0, 1)).
- Z-Score Standardization (Standard Scaling)
Z-Score standardization transforms the data such that the values have a mean of 0 and a standard deviation of 1. This is ideal when we want the data to be centered around 0. The formula is:
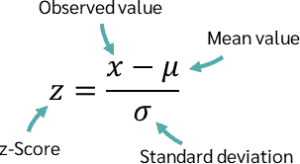
Z-Score normalization is particularly useful for algorithms like linear regression, logistic regression, and other methods sensitive to the scale of the data.
VBA Implementation for Z-Score Standardization:
Sub ZScoreStandardization()
    Dim ws As Worksheet
    Dim rng As Range
    Dim cell As Range
    Dim MeanVal As Double
    Dim StdDev As Double
    Dim ZScore As Double
    ' Set the worksheet and the range of data
    Set ws = ThisWorkbook.Sheets("Sheet1")
    Set rng = ws.Range("A2:A100") ' Modify range accordingly
    ' Calculate the mean and standard deviation
    MeanVal = Application.WorksheetFunction.Average(rng)
    StdDev = Application.WorksheetFunction.StDev(rng)
    ' Loop through each cell and apply Z-Score standardization
    For Each cell In rng
        ZScore = (cell.Value - MeanVal) / StdDev
        cell.Offset(0, 1).Value = ZScore ' Write the normalized value in the next column
    Next cell
End Sub
Explanation:
- The MeanVal is computed using the Average function, and the StdDev is calculated using StDev.
- The Z-score is computed and written to the adjacent column.
- Robust Scaling
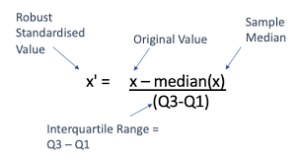
Robust Scaling uses the median and the interquartile range (IQR) to scale the data. It is useful when the data contains outliers, as it is less sensitive to extreme values compared to Min-Max Scaling and Z-Score Standardization. The formula is:
VBA Implementation for Robust Scaling:
Sub RobustScaling()
    Dim ws As Worksheet
    Dim rng As Range
    Dim cell As Range
    Dim MedianVal As Double
    Dim Q1 As Double
    Dim Q3 As Double
    Dim IQR As Double
    Dim ScaledValue As Double
    ' Set the worksheet and the range of data
    Set ws = ThisWorkbook.Sheets("Sheet1")
    Set rng = ws.Range("A2:A100") ' Modify range accordingly
    ' Calculate the median, 25th percentile (Q1), and 75th percentile (Q3)
    MedianVal = Application.WorksheetFunction.Median(rng)
    Q1 = Application.WorksheetFunction.Percentile(rng, 0.25)
    Q3 = Application.WorksheetFunction.Percentile(rng, 0.75)
    IQR = Q3 - Q1
    ' Loop through each cell and apply Robust scaling
    For Each cell In rng
        If IQR <> 0 Then
            ScaledValue = (cell.Value - MedianVal) / IQR
            cell.Offset(0, 1).Value = ScaledValue ' Write the normalized value in the next column
        Else
            cell.Offset(0, 1).Value = 0 ' In case IQR is zero, leave the value as 0
        End If
    Next cell
End Sub
Explanation:
- The Median, Q1 (25th percentile), and Q3 (75th percentile) are computed.
- The IQR is calculated as the difference between Q3 and Q1, and the scaling is done accordingly.
- Log Transformation
Log transformation is a nonlinear transformation that is useful for reducing the skewness of the data. It works well for data that has a long-tailed distribution. The formula is:
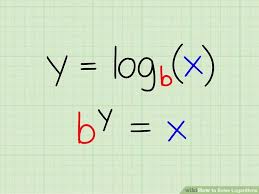
This transformation is commonly used for datasets with exponential growth, such as financial data.
VBA Implementation for Log Transformation:
Sub LogTransformation()
    Dim ws As Worksheet
    Dim rng As Range
    Dim cell As Range
    Dim LogValue As Double
    ' Set the worksheet and the range of data
    Set ws = ThisWorkbook.Sheets("Sheet1")
    Set rng = ws.Range("A2:A100") ' Modify range accordingly
    ' Loop through each cell and apply Log transformation
    For Each cell In rng
        If cell.Value > 0 Then
            LogValue = Log(cell.Value + 1)
            cell.Offset(0, 1).Value = LogValue ' Write the normalized value in the next column
        Else
            cell.Offset(0, 1).Value = 0 ' Handle non-positive values
        End If
    Next cell
End Sub
Explanation:
- The Log function is used to apply the logarithmic transformation. We add 1 to the value to avoid the logarithm of zero or negative values.
Conclusion:
These advanced data normalization techniques—Min-Max Scaling, Z-Score Standardization, Robust Scaling, and Log Transformation—help in transforming data to a suitable range for various machine learning models and data analysis tasks.
In the provided VBA code for each technique:
- The data is processed in the specified range (A2:A100 in the example).
- Normalized values are written to the adjacent column.
Make sure you adjust the range according to your dataset. These techniques are designed to handle different data distributions and can be chosen based on the characteristics of your dataset.