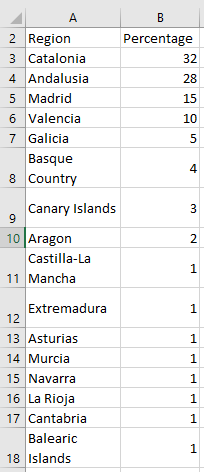
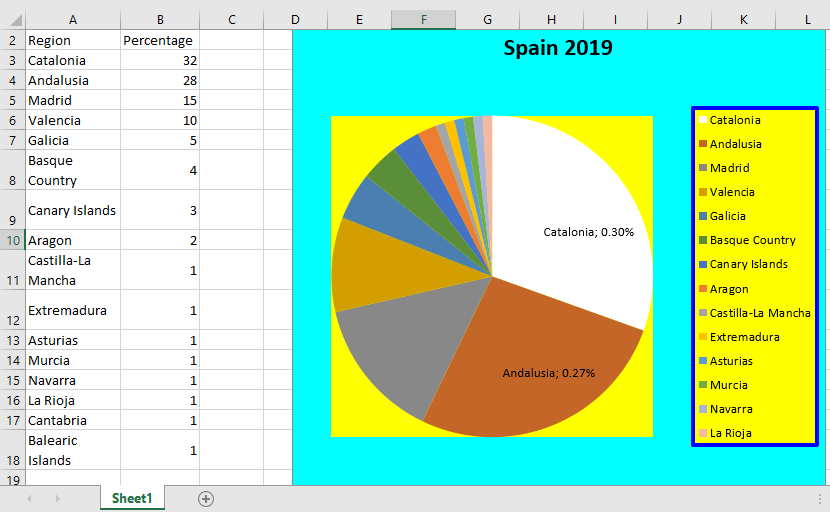
As another example of creating and formatting an embedded chart, the following illustrates a pie chart. You will notice that many general chart properties used in the line chart example can be applied here as well. However, some properties are unique to pie charts. The data source is election results from Spain in 2019,.
Code:
Sub CreatePieChart()
    Dim CO As ChartObject
    Dim CH As Chart
    Dim i As Integer
    Set CO = ThisWorkbook.Worksheets("Sheet2").ChartObjects.Add(200, 10, 400, 350)
    Set CH = CO.Chart
    ' Chart type and data source
    CH.ChartType = xlPie
    CH.SetSourceData Range("A1:B16")
    ' Chart and plot area formatting
    CH.ChartArea.Interior.Color = vbCyan
    CH.PlotArea.Interior.Color = vbYellow
    ' Title
    CH.HasTitle = True
    CH.ChartTitle.Text = "Spain 2019"
    ' Legend
    CH.HasLegend = True
    With CH.Legend
        .Interior.Color = vbYellow
        .Border.Color = vbBlue
        .Border.Weight = xlThick
    End With
    ' Data points formatting
    CH.SeriesCollection(1).Points(1).Interior.Color = vbWhite
    For i = 1 To CH.SeriesCollection(1).Points.Count
        If Cells(i + 1, 2) > 30 Then
            With CH.SeriesCollection(1).Points(i)
                .ApplyDataLabels xlDataLabelsShowLabelAndPercent
                .DataLabel.NumberFormatLocal = "0.00%"
            End With
        End If
    Next i
    Set CH = Nothing
    Set CO = Nothing
End Sub
Explanation:
As known, the ChartObjects.Add() method creates a new chart frame.
The chart type used is xlPie, which specifies a pie or doughnut chart.
The chart area, plot area, title, and legend can be formatted similarly to the line chart example.
However, data series behave differently in pie charts. For instance, there are no markers, but features like:
- xlDataLabelsShowLabelAndPercent — a special label type that shows both the category label and the percentage.
- An interior fill for each data point slice.
In this example, data points with values above a threshold (30 seats) receive data labels showing their category and percentage share. Additionally, the interior color of the first data point is set to white.
The DataLabel property controls the appearance of the labels. Here, the percentage is formatted to show two decimal places (« 0.00% »).