
The standard error of the mean (SEM), often abbreviated as the standard error (SE), is a measure of how much the sample mean is likely to vary from the population mean.
In other words, SEM measures the degree of variation between different samples taken from the same population, and it tells you how precisely the sample mean represents the true population mean. More broadly, the standard error indicates the degree of error you can expect in the sample mean when repeated samples are taken from the same population.
Mathematically, the standard error of the mean is typically calculated as the ratio of the standard deviation (SD) to the square root of the sample size (n):

Where σ is the standard deviation and n is the number of observations in the sample.
Excel provides an easy way to calculate the SEM using a combination of three functions, which we’ll discuss in more detail.
Importance of Calculating the Standard Error
When taking multiple samples from the same data set, calculating the standard error of the mean is important because it provides an estimate of the reliability of the sample means. A smaller standard error indicates that the sample means are more likely to be close to the true population mean, while a larger standard error suggests greater uncertainty in the estimates. Thus, the smaller the SEM, the more you can trust the accuracy of the sample mean.
The SEM is particularly useful in scientific research because it can be used to test hypotheses and determine the statistical significance of results. For example, researchers can compare sample means from two groups and calculate the SEM to determine whether the difference between the groups is likely due to chance or reflects a true difference within the population.
In summary, by providing a measure of the accuracy and precision of sample estimates, the standard error helps researchers draw more meaningful conclusions from their data. It guides decisions on sample size and statistical power, leading to more robust and reliable research outcomes.
Calculating the Standard Error of the Mean in Excel
Since the standard error is equal to the standard deviation divided by the square root of the sample size, Excel provides a simple way to calculate the SEM using three different functions.
Here’s how you can calculate the standard error of the mean in Excel:
- Enter your data in an Excel worksheet, organizing them in rows or columns.
- Calculate the sample standard deviation using the function STDEV.S.
- Find the sample size (the total number of values) using the COUNT function.
- Find the square root of the sample size using the SQRT function.
- Divide the standard deviation by the square root of the sample size.
The generic formula to calculate SEM in Excel is:
=STDEV.S(range)/SQRT(COUNT(range))
Where range refers to the range of cells containing your data.
For example, if your data range is from B2:B18, the SEM formula in Excel would look like this:
=STDEV.S(B2:B18)/SQRT(COUNT(B2:B18))
Once the formula is calculated, the result will appear as the standard error of the mean.

Finding the Standard Error Using the Analysis ToolPak
Another way to calculate the standard error of the mean in Excel is by using the Analysis ToolPak. To use this feature, you first need to ensure that the ToolPak add-in is installed in your Excel. Below are the steps to activate the Analysis ToolPak add-in in Excel.
Activating the Analysis ToolPak
With the Analysis ToolPak add-in enabled, you can calculate the standard error of the mean by following these steps:
-
Enter your sample data into a single column.
-
Go to the Data tab, and in the Analysis group, click on Data Analysis.

-
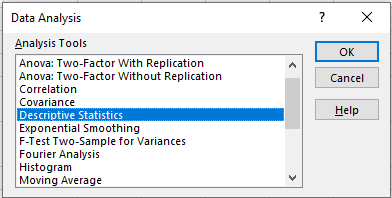
In the Data Analysis dialog box, select Descriptive Statistics from the list of analysis tools and click OK.
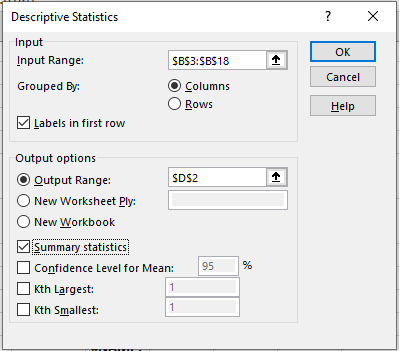
In the Descriptive Statistics dialog box, proceed as follows:
-
In the Input Range field, select the range of cells containing your sample data.
-
If you included column headers in your selection, make sure to check the box labeled « Labels in first row » to ensure the data is analyzed correctly.
-
In the Output Range section, choose where you want the results to appear. To avoid overwriting existing data, it’s safer to select New Worksheet Ply. If you prefer to display the results on the same sheet, choose the top-left cell of an empty area and ensure there’s at least one empty column to the right.
-
Check the box next to Summary statistics, and click OK.
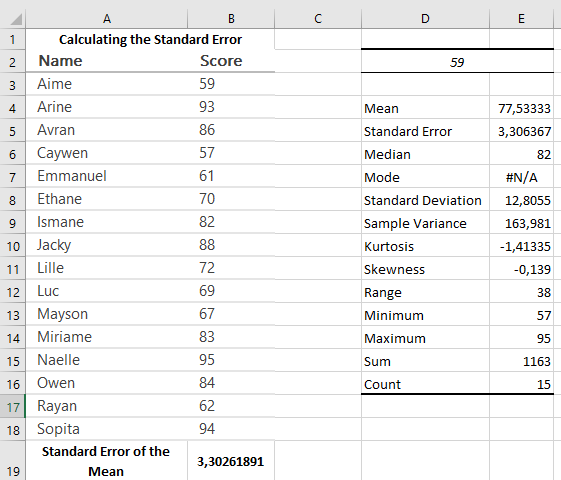
Excel will now generate a new table containing various descriptive statistics for your sample data, including the standard error of the mean. You can verify that the standard error value exactly matches the SEM (Standard Error of the Mean) calculated using the formula, as shown in the screenshot below.
Adding Standard Error Bars in Excel
To visually display the variability of data points and highlight the precision of the sample mean, you can add standard error bars to an Excel chart. The standard error bars show the range of values within which the sample mean is likely to fall, given a specific confidence level.
To add standard error bars to an Excel chart, follow these steps:
- Create a chart from your data. Select the data range, go to the Insert tab, and choose the desired chart type from the Charts group.
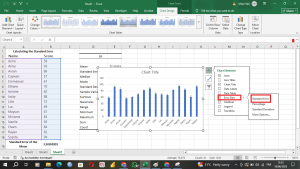
- Select the chart, then click the Chart Elements button at the top right of the chart.
- In the dropdown menu, click the arrow next to Error Bars and select Standard Error.
The standard error bars will be added to your chart, helping you compare the means across different groups and assess the significance of any observed differences.
Standard Error of the Mean vs. Standard Deviation
The standard deviation and the standard error of the mean are two related statistical concepts that are often used to measure the variability of data. Although they may seem similar, they have different meanings and uses.
- Standard Deviation (SD) measures the amount of variation or dispersion in a data set from its mean. A high standard deviation indicates that the data points are spread out far from the mean, while a low standard deviation suggests that the data points are closer to the mean.
- Standard Error of the Mean (SEM) measures the variability of the sample mean compared to the population mean. The standard error indicates how accurately the sample mean represents the true population mean, and it reflects the degree of error expected when taking multiple samples from the same population. A low SEM suggests that the sample mean is a good estimate of the population mean, while a high SEM suggests that the sample mean may not be a reliable estimate of the population mean.
The standard error of the mean is always smaller than the standard deviation because it is calculated by dividing the standard deviation by the square root of the sample size, which reduces its value.

In Summary:
- The standard deviation measures variability within a dataset, while the standard error of the mean measures how much the sample mean is likely to vary from the true population mean.
- Excel provides simple ways to calculate SEM, either through functions like STDEV.S and SQRT or using the Analysis ToolPak for more detailed descriptive statistics.
- SEM is particularly useful for estimating the precision of sample means and is often used in scientific research to assess the reliability of data.