✅ What Is the FREQUENCY Function?
The FREQUENCY function in Excel counts how often values occur within a range of values (called « bins »). It returns a vertical array of numbers that show the count of items falling into each bin.
Syntax
=FREQUENCY(data_array, bins_array)
- data_array: The range or array of numbers to analyze.
- bins_array: The intervals that group the values.
⚠️ Important: This is an array formula. In older versions of Excel (before 365/2021), you must press CTRL + SHIFT + ENTER (or CMD + SHIFT + ENTER on Mac). In Excel 365+, it’s automatically handled.
Examples and Test Data
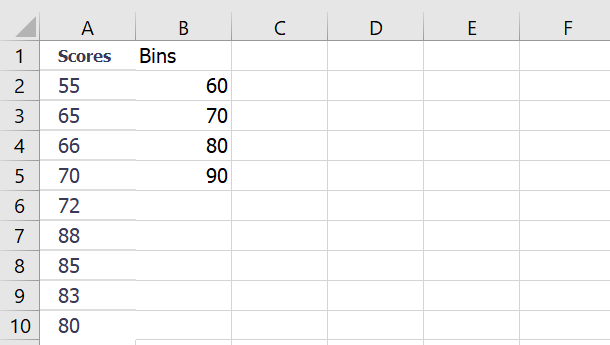
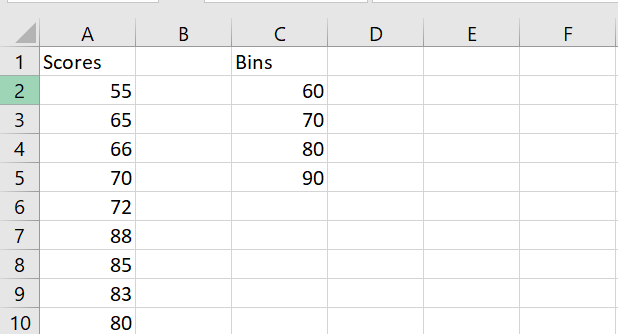
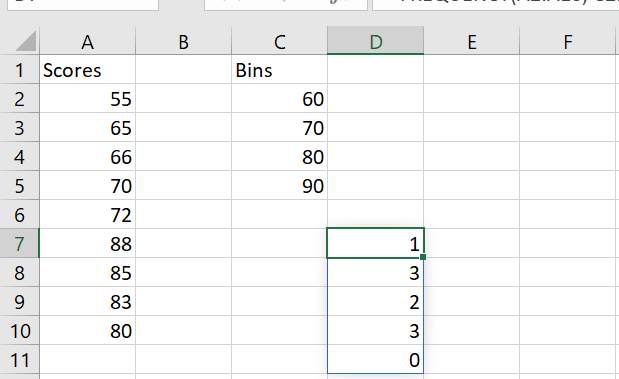
Example #1: Exam Scores
Steps:
- Select 5 vertical cells (one more than number of bins).
- Use this formula:
=FREQUENCY(A2:A10, C2:C5)
- Press CTRL+SHIFT+ENTER (older Excel) or just Enter (Excel 365+).
- Result:
| Interval | Frequency |
| <=60 | 1 |
| 61–70 | 3 |
| 71–80 | 1 |
| 81–90 | 4 |
| >90 | 0 |
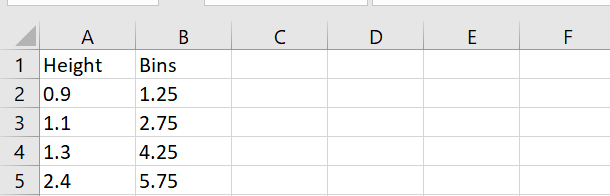
Example #2: Children’s Heights
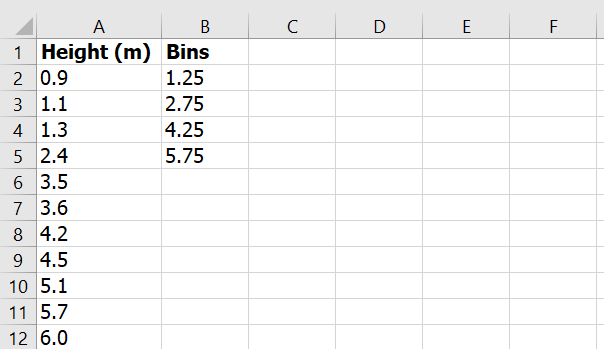
Steps:
=FREQUENCY(A2:A12, C2:C5)
Result:
| Range | Frequency |
| <=1.25 | 2 |
| 1.26–2.75 | 2 |
| 2.76–4.25 | 3 |
| 4.26–5.75 | 3 |
| >5.75 | 1 |
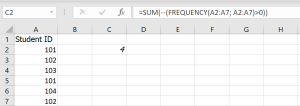
Example #3: Count Unique Failed Students
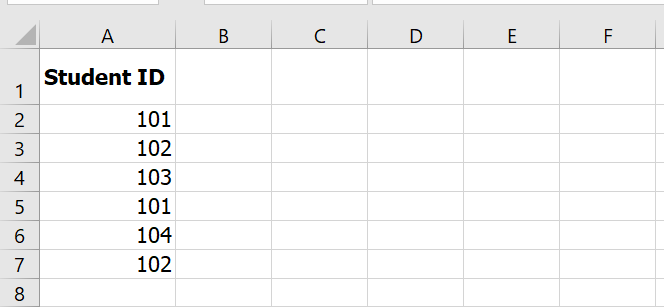
Formula:
=SUM(–(FREQUENCY(A2:A7, A2:A7) > 0))
Explanation:
- FREQUENCY(…, …) > 0 identifies which IDs are unique.
- — converts TRUE/FALSE to 1/0.
- SUM(…) adds them up.
✅ Result: 4 unique failed students
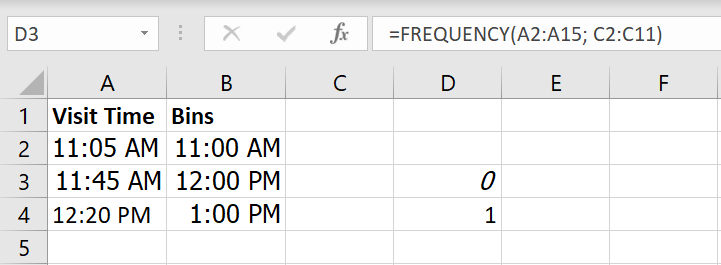
Example #4: Store Visit Frequency (Hourly)
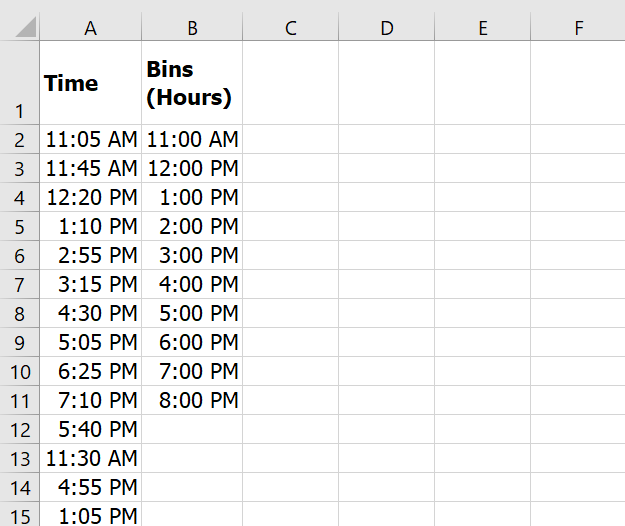
Formula:
=FREQUENCY(A2:A15, C2:C11)
✅ Result: Frequencies of visits within each 1-hour window.
Sample Data to Use in Excel
Here’s how you can set up the data in your Excel workbook:
Sheet1 – Exam Scores
Sheet2 – Heights
Sheet3 – Failed Students
Sheet4 – Store Visits
Summary: Key Notes
- Always select N+1 cells where N = number of bins.
- Use CTRL + SHIFT + ENTER in older Excel versions.
- FREQUENCY helps group values: marks, ages, times, etc.
- It returns an array of frequencies.
- Best used for distributions, surveys, or trend analysis.