
1. What is the QUARTILE Function?
The QUARTILE function is a statistical tool in Excel used to divide a dataset into four equal parts. These parts are known as quartiles.
| Quart Argument | Returns |
| 0 | Minimum value |
| 1 | First quartile (Q1 = 25th percentile) |
| 2 | Second quartile (Q2 = median or 50th percentile) |
| 3 | Third quartile (Q3 = 75th percentile) |
| 4 | Maximum value |
2. Syntax
=QUARTILE(array, quart)
- array: A range of numeric data (like A2:A10).
- quart: A number from 0 to 4 indicating the quartile you want.
✅ Note: In newer versions of Excel, QUARTILE has been replaced by two updated functions:
- QUARTILE.INC – inclusive of 0 and 1
- QUARTILE.EXC – exclusive of 0 and 1
3. Example Datasets to Practice
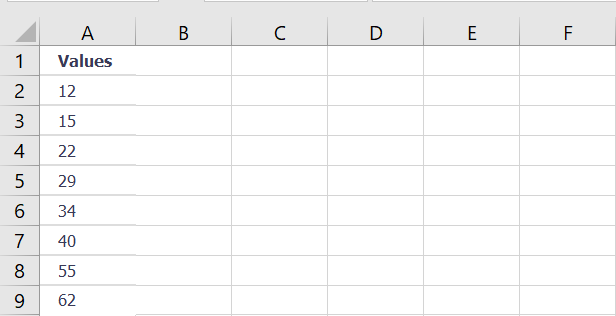
Dataset #1 – Small Dataset
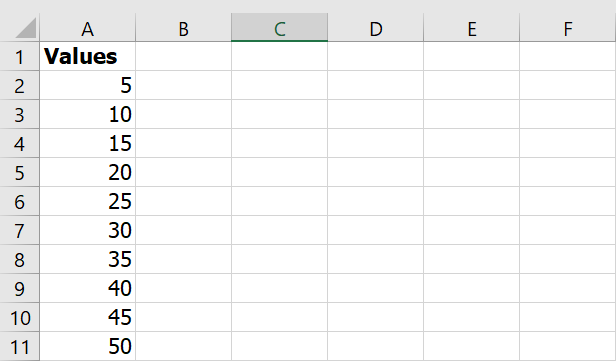
Dataset #2 – Sorted Dataset
4. Using the QUARTILE Function
To use the function, follow these steps:
- Enter your data into a column (e.g., A2:A9).
- In other cells, use these formulas:
=QUARTILE(A2:A9, 0) → Minimum value
=QUARTILE(A2:A9, 1) → First quartile (Q1)
=QUARTILE(A2:A9, 2) → Median (Q2)
=QUARTILE(A2:A9, 3) → Third quartile (Q3)
=QUARTILE(A2:A9, 4) → Maximum value
✅ Replace QUARTILE with QUARTILE.INC or QUARTILE.EXC to test different quartile methods.
5. Example Calculation – Interpreting Results
Using Dataset #1:
Sorted Data: 12, 15, 22, 29, 34, 40, 55, 62
| Quartile Type | Excel Formula | Result |
| Minimum | =QUARTILE.INC(A2:A9, 0) | 12 |
| Q1 (25%) | =QUARTILE.INC(A2:A9, 1) | 18.5 |
| Q2 (Median) | =QUARTILE.INC(A2:A9, 2) | 31.5 |
| Q3 (75%) | =QUARTILE.INC(A2:A9, 3) | 48.75 |
| Maximum | =QUARTILE.INC(A2:A9, 4) | 62 |
6. QUARTILE.INC vs QUARTILE.EXC – What’s the Difference?
| Function | Includes Min/Max? | Supports values 0 and 4? | Behavior |
| QUARTILE.INC | ✅ Yes | ✅ Yes | Same as old QUARTILE |
| QUARTILE.EXC | ❌ No | ❌ No (returns #NUM!) | More strict |
Example: QUARTILE.EXC(A2:A9, 0) will return #NUM! error because it doesn’t calculate the minimum or maximum.
Excel Practice File Layout
You can build your Excel test like this:
| A (Data) | B (Formula) | C (Label) |
| 12 | =QUARTILE.INC(A2:A9, 0) | Minimum |
| 15 | =QUARTILE.INC(A2:A9, 1) | First Quartile |
| 22 | =QUARTILE.INC(A2:A9, 2) | Median |
| 29 | =QUARTILE.INC(A2:A9, 3) | Third Quartile |
| 34 | =QUARTILE.INC(A2:A9, 4) | Maximum |
Bonus Tips
- Use PERCENTILE.INC(array, k) if you want a specific percentile like 90% or 33%.
- Combine quartiles with a Box & Whisker chart for visual analysis.
- Useful for analyzing: salaries, exam scores, sales data, customer response times, etc.
Want a Downloadable Excel Template?
Would you like me to generate a downloadable Excel file with the examples?
Please choose:
- Basic quartile analysis
- Quartile.INC vs Quartile.EXC comparison
- Boxplot-ready version