
1. What is a Confidence Interval?
A Confidence Interval (CI) is a range of values that estimates the true population parameter (usually the mean), based on sample data. It tells us how confident we are that the actual mean falls within that range.
For example:
If the 95% confidence interval for a sample mean is (60.31, 81.88), we can say that we are 95% confident that the population mean lies between those two values.
2. Formula for Confidence Interval in Excel
We use this formula:
Confidence Interval = Sample Mean ± Confidence Value
The confidence value is calculated using the CONFIDENCE.NORM function (for normal distribution):
=CONFIDENCE.NORM(alpha, standard_dev, size)
- alpha = 1 – Confidence Level (e.g., 0.05 for 95%)
- standard_dev = Standard deviation of the sample
- size = Sample size
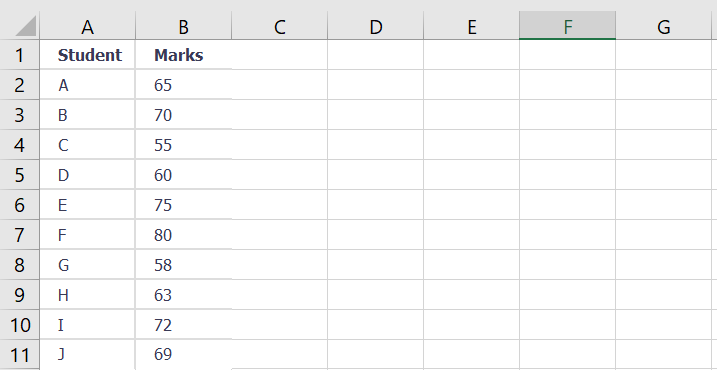
3. Sample Dataset
4. Steps in Excel
✅ Step 1: Calculate Sample Mean
Use the AVERAGE function:
=AVERAGE(B2:B11)
✅ Step 2: Calculate Standard Deviation
Use STDEV.P (population) or STDEV.S (sample). For samples, use:
=STDEV.S(B2:B11)
✅ Step 3: Set Significance Level (Alpha)
If you want a 95% confidence level:
=1 – 0.95 → 0.05
Put 0.05 in a cell like E4.
✅ Step 4: Calculate Sample Size
Use the COUNT function:
=COUNT(B2:B11)
✅ Step 5: Calculate Confidence Value
Use CONFIDENCE.NORM function:
=CONFIDENCE.NORM(E4, E3, E5)
Assuming:
- E4 = alpha (0.05)
- E3 = standard deviation
- E5 = sample size
✅ Step 6: Calculate Confidence Interval Bounds
Lower Bound:
=Mean – Confidence_Value
Upper Bound:
=Mean + Confidence_Value
If the mean is in E2 and confidence value in E6:
Lower Bound = E2 – E6
Upper Bound = E2 + E6
5. Example Output
Let’s say:
- Mean = 66.7
- Standard Deviation = 8.14
- Sample Size = 10
- Alpha = 0.05
- Confidence Value = 5.27
Then:
- Lower Bound = 66.7 – 5.27 = 61.43
- Upper Bound = 66.7 + 5.27 = 71.97
✅ So, the 95% Confidence Interval is (61.43, 71.97).
6. Important Notes
- Use STDEV.S for sample data and STDEV.P for population data.
- CONFIDENCE.NORM assumes normal distribution.
- For small samples (n < 30), consider using CONFIDENCE.T instead.
7. Downloadable Excel Template
You can easily recreate the spreadsheet using this structure:
| Metric | Formula | Cell |
| Mean | =AVERAGE(B2:B11) | E2 |
| Std Dev (Sample) | =STDEV.S(B2:B11) | E3 |
| Alpha (0.05 for 95%) | 0.05 | E4 |
| Sample Size | =COUNT(B2:B11) | E5 |
| Confidence Value | =CONFIDENCE.NORM(E4,E3,E5) | E6 |
| Lower Bound | =E2-E6 | E7 |
| Upper Bound | =E2+E6 | E8 |
8. Conclusion
You now have:
- A clear understanding of Confidence Intervals
- A method to calculate them using Excel
- A real-world dataset to practice with
- Formulas and steps to apply in your own data analysis