
This function returns the average of the absolute deviations of data points from their mean. The function calculates the arithmetic mean of the deviations of a data set based on the average, excluding the sign.
Syntax:
AVEDEV(number1, number2, …)
AVEDEV() is a measure of the variance in a data set.
Arguments:
- number1(required) and number2 (optional): At least one and up to 255 arguments for which you want to calculate the absolute deviation. You can also use a single array or a reference to an array instead of arguments separated by commas.
Background:
To calculate the deviation of sales or, as in our example, the monthly website visits relative to the mean, use the AVEDEV() function.
AVEDEV() is a measure of the variance in a data set.
In a sense, measures of dispersion serve as a quality criterion for the measure of central tendency. These measures indicate the accuracy of a measure of central tendency. Variance parameters refer to the difference between the following:
- Location values (range, quartile, or semi-quartile distance)
- Individual values and a mean (average linear deviation, variance, standard deviation)
Example:
The marketing department of a software company wants to analyse customer website visits. The visits to various website areas over the past 18 months are recorded in an Excel table (see table below).
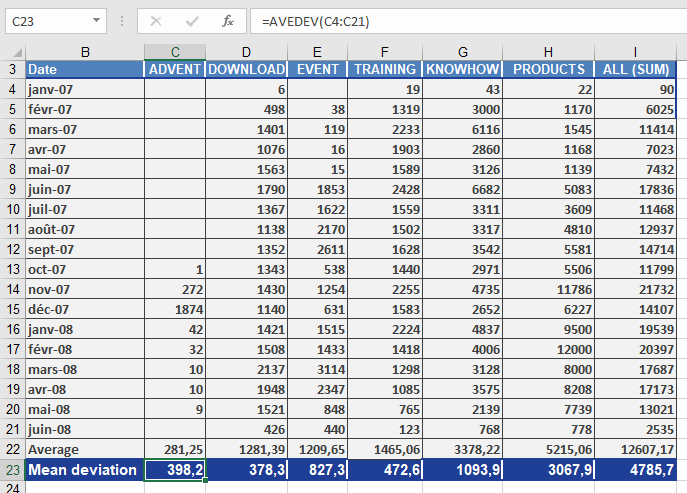
Since the average deviation refers to the mean values in the data sets, the marketing department calculates the mean value for each website area using the AVERAGE() function. Afterwards, they calculate the average deviation for each data set. The AVEDEV() function returns the results—the arithmetic mean of the deviation from the mean value.
Now, the mean values and average deviations can be compared and analyzed. The following conclusions can be drawn from this result:
The AVEDEV() function is a measure of the variance in a data set, where the variance parameters refer to the differences between individual values and mean values.
For example, the average deviation for the DOWNLOAD area is 378.3 per month. This means that, compared to the calculated mean value, the visits to the DOWNLOAD area vary by 378.3 each month.