Population sampling is the process of selecting a representative subset of individuals from an entire population. This subset, known as a sample, must be sufficiently large to allow for meaningful and statistically valid analysis. Sampling is typically employed because it is often impractical or impossible to test every member of the population due to constraints such as time, cost, and logistical challenges. The primary objective of sampling is to save resources while still obtaining data that accurately reflects the characteristics of the whole population. However, researchers must always keep in mind that the ideal scenario is to assess every individual within the population to achieve results that are as reliable, valid, and precise as possible. Only when testing the entire population is not feasible do researchers resort to sampling techniques, carefully designed to minimize bias and maximize representativeness.
Sampling Distribution Formula
A sampling distribution is defined as the probability distribution of a given statistic based on repeated samples drawn from a population. This distribution enables the calculation (or estimation) of key sample statistics such as the mean, range, standard deviation, and variance.
For a sample size greater than 30, the sampling distribution formulas are as follows:
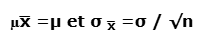
Where:
-
μˉx represents the mean of the sample, which estimates the population mean μ
-
σxˉ is the standard deviation of the sampling distribution (also called the standard error of the mean), while σ is the population standard deviation.
-
n is the sample size, which is assumed to be greater than 30 in this context.
Many professionals—including analysts, researchers, and statisticians—utilize the concept of sampling distribution for their investigations. When dealing with a large population, this approach allows the selection of a smaller, manageable sample that can be used to estimate population parameters such as the mean and standard deviation.
The process for calculating the sampling distribution typically involves the following steps:
-
Identify multiple samples of size nnn drawn from the larger population of size NNN.
-
List these samples and compute the mean of each individual sample.
-
Construct a frequency distribution of these sample means obtained in step 2.
-
Determine the probability distribution of the sample means based on the frequency distribution, which represents the sampling distribution.
This methodology provides insight into how sample statistics vary from sample to sample and forms the foundation for inferential statistics.
Example
Let’s take the example of taxes paid by vehicles. In California, the average tax paid is $12,225, with a standard deviation of $5,000. Observations were made on a sample of 400 trucks and trailers combined. Help the Department of Transportation determine the sample mean and the sample standard deviation.
Solution
Use the data below to calculate the sampling distribution.
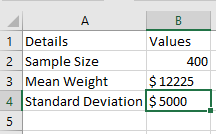
The calculation of the standard deviation for the sample size is as follows:
= $5,000 / √400
The standard deviation of the sample size will be –
σₓ̄ = $250
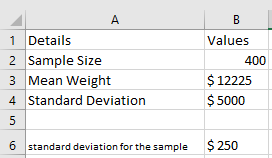
Therefore, the sample standard deviation, as estimated by the Department of Transportation, is $250, and the sample mean is $12,225.
Sample Size Formula
The sample size formula helps calculate or determine the minimum sample size required to accurately estimate the true proportion of a population, considering the desired confidence level and margin of error.
A sample refers to a subset of the population that allows us to make inferences about the entire population. Therefore, the sample size must be adequate to produce meaningful and statistically significant conclusions. In other words, it is the minimum number of observations needed to estimate the population proportion within a specified margin of error and confidence level. Consequently, determining the appropriate sample size is a common and critical challenge in statistical analysis. This formula is derived using the population size, the critical value from the normal distribution, the sample proportion, and the margin of error.
The formula for sample size n is:
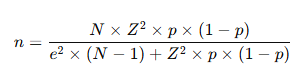
Where:
-
N= Population size
-
Z= Critical value from the normal distribution corresponding to the desired confidence level
-
p = Sample proportion (estimated proportion of the attribute present in the population)
-
e = Margin of error (the allowable error tolerance)
As the sample size increases, the sampling distribution approaches a normal distribution. Meanwhile, the standard deviation (standard error) of the sampling distribution decreases as nnn increases.
If the sample size is too small, the results may not be reliable. Conversely, an excessively large sample size can lead to unnecessary expenditure of time and resources. Therefore, it is important to choose a reasonable sample size for fields such as market research, healthcare studies, and educational surveys.
How to Calculate Sample Size? (Step-by-step)
-
Determine the population size (NNN): This is the total number of distinct entities in your population.
-
Identify the critical value (ZZZ): Find the critical value from the normal distribution associated with your desired confidence level. For example, for a 95% confidence level, the critical value is 1.96.
-
Estimate the sample proportion (ppp): This can be derived from previous surveys or small pilot studies. Note: If unknown, use 0.5 as a conservative estimate, which will yield the largest required sample size.
-
Set the margin of error (eee): This is the range within which the true population parameter is expected to fall. Note: A smaller margin of error indicates higher precision and requires a larger sample size.
-
Apply the formula using the values from steps 1 to 4 to calculate the minimum sample size required.
Additional Practical Note:
When the population size is less than 1,000, an ideal sample size is often around 10% of the population. For example, if the population is 10,000 individuals, a 10% sample corresponds to 1,000 individuals.
Example
Let’s take the example of a retailer who wants to know how many of their customers purchased an item from them after visiting their website on a particular day. Given that their website has, on average, 10,000 views per day, determine the sample size of customers they need to monitor at a 95% confidence level with a 5% margin of error if:
■ They are uncertain about the current conversion rate.
■ They know from previous surveys that the conversion rate is 5%.
Data
■ Population size, N = 10,000
■ Critical value at 95% confidence level, Z = 1.96
■ Margin of error, e = 5% or 0.05
Since the current conversion rate is unknown, assume p = 0.5
Therefore, the sample size can be calculated using the formula:
Substituting the values:

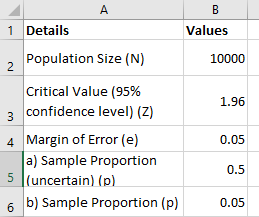
Therefore, 370 customers will be sufficient to make meaningful inferences.
2 – The current conversion rate is p = 5% or 0.05
Therefore, the sample size can be calculated using the formula above:
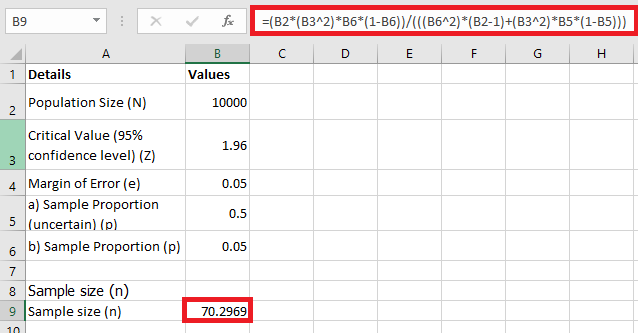

Therefore, a sample size of 70 customers will be sufficient to make meaningful inferences in this case.
Calculating the sample size is important to understand the concept of an appropriate sample size, as it can be used to validate research results. If the sample size is too small, it will not provide valid results, while a sample that is too large can be a waste of money and time. Therefore, it is advisable to use a considerable sample size for market research, healthcare, and educational surveys.
Sampling Error Formula
A sampling error is a statistical error that occurs when an analyst selects a sample that is not representative of the entire data population. As a result, the findings from the sample do not accurately reflect the results that would be obtained from the full population.
Sampling involves analyzing a subset of observations drawn from a larger population. The selection method can introduce both sampling errors and non-sampling errors.
Key Points to Remember:
-
Sampling error arises when the sample used in a study does not adequately represent the whole population.
-
Sampling is the process of selecting a certain number of observations from a larger population for analysis.
-
Even randomized samples will contain some degree of sampling error because a sample is inherently only an approximation of the population from which it is drawn.
-
The magnitude of sampling errors can be reduced by increasing the sample size.
-
Generally, sampling errors can be classified into four categories: population-specific error, selection error, sampling frame error, and non-response error.
According to the formula, the sampling error is calculated by dividing the population standard deviation by the square root of the sample size, and then multiplying the result by the Z-score corresponding to the desired confidence interval.
Sampling error represents the difference between the sample statistic and the true population value. Sampling errors occur because the sample is either not representative of the population or is biased in some way. Even random samples will exhibit some level of sampling error, since a sample can only approximate the population.
Step-by-Step Calculation of Sampling Error:
The sampling error formula is used to calculate the overall sampling error in statistical analysis. It is given by:
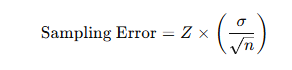
Where:
Steps to calculate sampling error:
-
Collect the full dataset (population): Calculate the population mean and population standard deviation.
-
Determine the sample size: The sample size must be smaller than the population size.
-
Identify the confidence level: Based on this, find the corresponding Z-score from a standard normal distribution table.
-
Calculate the sampling error: Multiply the Z-score by the population standard deviation, then divide by the square root of the sample size. This gives the margin of error or the sampling error.
Types of Sampling Errors
There are different categories of sampling errors, each arising from distinct issues in the sampling process:
-
Population-Specific Error
This type of error occurs when the researcher does not correctly identify the target population to be surveyed. Misunderstanding who should be included in the study leads to unrepresentative samples and biased results.
-
Selection Error
Selection error happens when the survey participants are self-selected or when only those interested in the survey choose to respond. This can lead to biased samples because the participants are not randomly chosen. Researchers often try to mitigate selection errors by implementing strategies to encourage broader participation.
-
Sampling Frame Error
Sampling frame error arises when the sample is drawn from an inaccurate or incomplete population list (sampling frame). If the sampling frame does not correctly represent the entire population, the resulting sample will be biased.
-
Non-Response Error
Non-response error occurs when useful responses are not obtained from selected participants because researchers fail to contact them or because those contacted refuse to participate. This missing data can lead to biased estimates if the non-respondents differ significantly from respondents.
Example 1
Suppose the population standard deviation is 0.30 and the sample size is 100. What is the sampling error at a 95% confidence level?
Solution
We are given the population standard deviation and the sample size. Therefore, we can use the following formula to calculate the sampling error:
Using the data below for the calculation:
The sampling error calculation is:

Thus, the sampling error at a 95% confidence level is approximately 0.0588.

Example 2
Gautam is currently taking accounting courses and has passed his entry exam. He is now enrolled at the intermediate level and will also join a senior accountant as an intern. Additionally, he will be working on an audit of manufacturing companies.
One of the companies he visited for the first time requested verification that invoices for all purchase transactions were reasonably available. Gautam selected a sample size of 50, and the population standard deviation for this audit variable is 0.50.
Based on the information available, you are asked to calculate the sampling error at both 95% and 99% confidence intervals.
Solution
We are given the population standard deviation and the sample size. Therefore, we can use the sampling error formula:
Data for calculation:
-
Sample size, n=50n = 50n=50
-
Population standard deviation, σ=0.50\sigma = 0.50σ=0.50
At 95% confidence level:

At 99% confidence level:

Conclusion:
The sampling error is approximately 0.1386 at the 95% confidence level and 0.1820 at the 99% confidence level.
Eliminating Sampling Errors
Understanding the concept of sampling error is essential, as it indicates how accurately the results of a survey are expected to reflect the overall views of the population. It’s important to remember that surveys typically rely on a smaller group, known as the sample size (or survey respondents), to represent a much larger population.
Sampling error can also be viewed as a measure of the effectiveness and precision of the survey. A larger margin of error implies that the survey results may significantly deviate from the true characteristics of the population. Conversely, a smaller margin of error or sampling error indicates that the results more closely approximate the true population values, thereby increasing the reliability and confidence level of the ongoing survey.
Strategies to Reduce Sampling Error:
-
Increase the Sample Size
As the sample size increases, the sample more closely resembles the actual population, thereby reducing the risk of deviation from population parameters. For example, the mean of a sample of 10 individuals is likely to fluctuate more than that of a sample of 100 individuals. A larger sample reduces variability and leads to more precise estimates.
-
Ensure Representativeness of the Sample
Researchers should take proactive steps to ensure that the sample reflects the diversity and characteristics of the entire population. This includes avoiding over-representation or under-representation of specific subgroups.
-
Replicate the Study
One effective way to reduce sampling error is to replicate the research. This can be done by:
-
Repeating measurements multiple times.
-
Using more than one subject or group in the study.
-
Conducting multiple independent studies on the same topic.
Replication helps verify consistency and increases the reliability of the results.
-
Use Random Sampling Methods
Random sampling is a powerful technique to minimize sampling errors. It involves using a systematic and unbiased method to select participants from the population. For instance, instead of randomly selecting participants without a plan, a researcher might adopt systematic random sampling by selecting every 10th, 20th, or 30th individual on a list.
Conclusion:
Reducing sampling error is crucial for improving the accuracy and trustworthiness of survey results. Through increasing sample size, ensuring representativeness, replicating studies, and applying random sampling techniques, researchers can minimize bias and better reflect the true characteristics of the population being studied.
