
This function returns the values of a distribution function (1 – alpha) of a right-tailed F-distributed random variable. Use this function to determine whether two data sets have different variances.
For example, you can compare the survey results of three equal employee groups to determine whether the variance in results is statistically different.
Syntax
F.DIST.RT(x; degrees_freedom1; degrees_freedom2)
Arguments
- x (required): The value at which to evaluate the function.
- degrees_freedom1 (required): The degrees of freedom in the numerator.
- degrees_freedom2 (required): The degrees of freedom in the denominator.
Background
- The F.DIST.RT() function returns the significance level (probability) based on a given F-value.
- It calculates the probability (significance level) for the critical F-values determined by F.INV.RT().
- The F.INV.RT() function, in contrast, calculates the critical F-value based on a given probability and degrees of freedom.
Example
In a survey, 15 employees answered 10 questions, each with three possible answers (see Figure below).
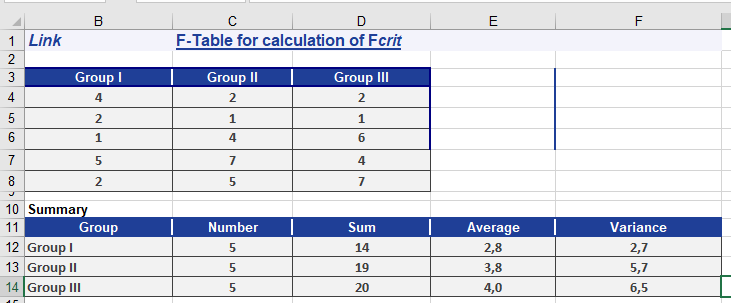
- Null hypothesis (H₀): No difference exists between the three groups.
- Alternative hypothesis (H₁): A significant difference exists.
A variance analysis returns the results shown in Figure below.
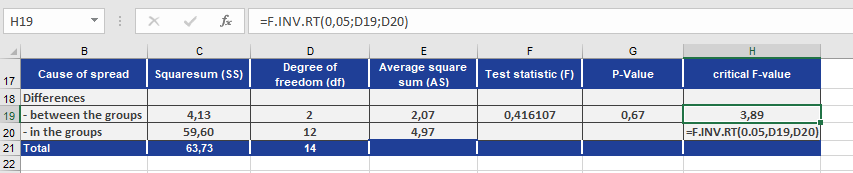
- Using F.INV.RT() with a significance level (α) of 0.05, the critical F-value is calculated as 3.89.
- F.DIST.RT() returns a significance level of 0.05 for this critical value.
The function uses the values from Figure to compute F.DIST.RT().
The calculation of the significance level for F produces the result shown in Figure below.

- F.DIST.RT() returns a probability of 0.67 (67%) for the test statistic F = 0.4161 (see Figure below).
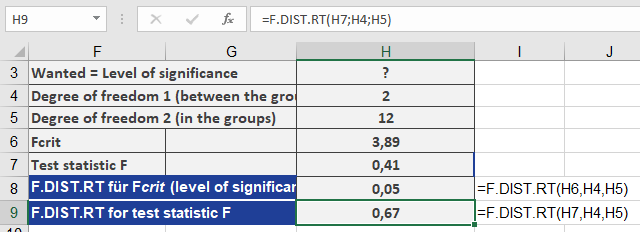
Since the significance level (α = 0.05) is less than the p-value (0.67), the null hypothesis is not rejected. This means there is no significant difference between the groups.
Key Notes
- F.DIST.RT() calculates the right-tailed probability (significance level) for a given F-statistic.
- If the returned p-value > α, the null hypothesis is retained (no significant difference).
- If p-value ≤ α, the null hypothesis is rejected (significant difference exists).