The GROWTH function calculates predicted values based on an exponential trend. It returns y-values corresponding to a specified set of new x-values using existing x and y data. It can also fit an exponential curve to known data points.
Syntax:
GROWTH(known_y’s; known_x’s; new_x’s; const)
Arguments
- known_y’s (required) – The dependent y-values from the exponential relationship y = b * m^x.
- If known_y’s is a single column, each column in known_x’s is treated as an independent variable.
- If known_y’s is a single row, each row in known_x’s is treated as an independent variable.
- known_x’s (optional) – The independent x-values from the relationship y = b * m^x.
- Supports single or multiple variable sets. If only one variable is used, known_y’s and known_x’s can be any shape but must have matching dimensions. For multiple variables, known_y’s must be a vector (single row or column).
- If omitted, defaults to {1, 2, 3, …} with the same length as known_y’s.
- Requirements:
- known_y’s and known_x’s must have the same number of rows/columns. A mismatch returns #REF!.
- Any zero or negative y-value returns #NUM!.
- new_x’s (optional) – New x-values for which to predict y-values.
- Must match known_x’s in structure:
- If known_y’s is a column, new_x’s must have the same columns.
- If known_y’s is a row, new_x’s must have the same rows.
- If omitted, defaults to known_x’s.
- If both known_x’s and new_x’s are omitted, they default to {1, 2, 3, …} (same length as known_y’s).
- Must match known_x’s in structure:
- const (optional) – Logical value controlling the constant b in y = b * m^x:
- TRUE (or omitted): Calculates b normally.
- FALSE: Forces b = 1, adjusting m to fit y = m^x.
Background
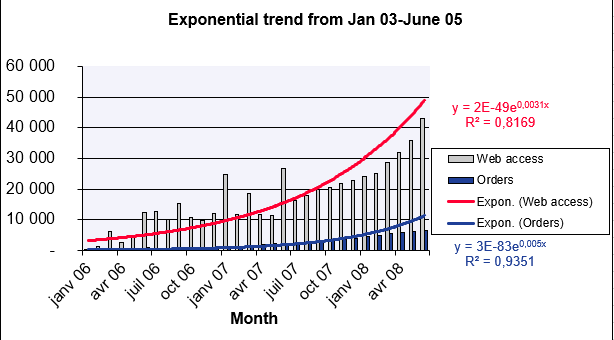
While TREND() models linear trends, GROWTH() fits exponential trends, useful when data grows by a fixed factor or percentage. It projects future values by fitting an exponential curve to historical data.
Example
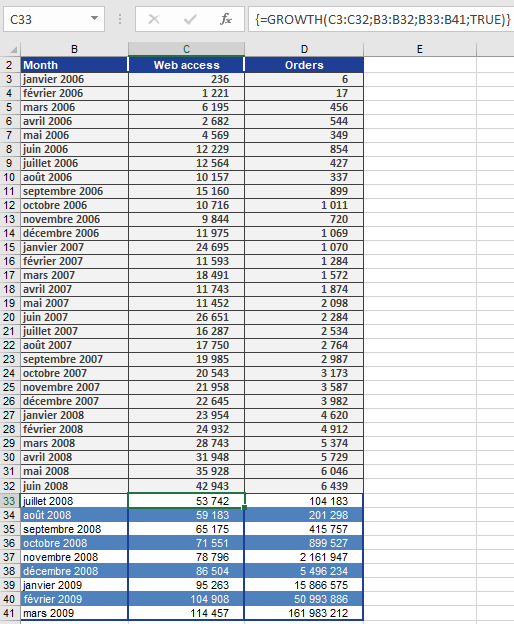
A marketing manager analyzes website visits and online orders (Figure below), which grew exponentially from January 2007–June 2008. To forecast July 2008–March 2009:
Website Visits Forecast
- known_y’s: Visits (Jan–Jun 2008).
- known_x’s: Months (Jan 2006–Jun 2008).
- new_x’s: Months (Jul 2008–Mar 2009).
- const: TRUE (calculate b normally).
Result: Predicted values shown in Figure below.
Online Orders Forecast
Using the same method, orders are projected (Figure below).

Conclusion
GROWTH() provides accurate exponential trend forecasts, assuming historical growth patterns continue.