
This function returns the probability (either cumulative or density) for a given z-value in the standard normal distribution (mean = 0, standard deviation = 1). It eliminates the need for traditional statistical tables.
Syntax:
NORM.S.DIST(z ; cumulative)
Arguments:
- z (required) – The quantile (standardized value) for which the probability is calculated.
- cumulative (required) – A logical value determining the output:
- TRUE: Returns the cumulative distribution function (CDF).
- FALSE: Returns the probability density function (PDF).
Background:
The standard normal distribution has:
- Mean (μ) = 0
- Standard deviation (σ) = 1
Its density function is given by:
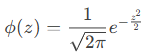
- CDF (cumulative = TRUE): Returns P(Z≤z)(e.g., the area under the curve to the left of *z*).
- PDF (cumulative = FALSE): Returns the height of the curve at *z*.
Example:
Using the light bulb lifespan data from the STANDARDIZE() example:
- Measurements are standardized to z-values (e.g., –1.728 in cell D2).
- To find the probability for each z-value:
=NORM.S.DIST(D2, TRUE) // Returns cumulative probability
Results (see Figure below):
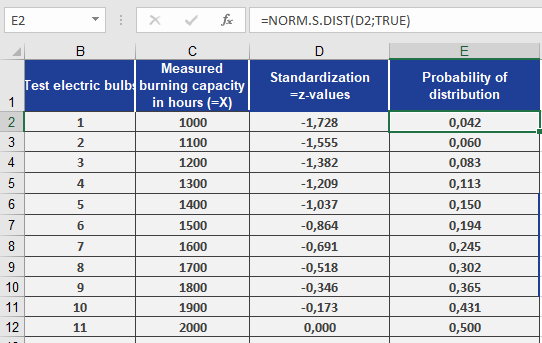
- For z = –1.728, the probability is 4.2% (cell E2).
Interpretation: Only 4.2% of bulbs have a lifespan ≤ this z-value.