This function returns the rank of a value (alpha) as a percentage. It can be used to evaluate the relative position of a value within a dataset. For example, you can use PERCENTRANK() to assess the standing of an aptitude test score compared to all other test scores.
Syntax:
PERCENTRANK(array; x; [significance])
Arguments:
- array(required): The array or range of numeric data that defines the relative positions.
- x(required): The value for which you want to determine the rank.
- significance(optional): A value specifying the number of decimal places for the returned percentage. If omitted, PERCENTRANK() defaults to three decimal places (0.xxx).
Background:
PERCENTRANK() is the inverse of PERCENTILE(). It calculates the relative position of a value *x* within a dataset. For more details on quantiles, refer to the PERCENTILE() documentation.
Example:
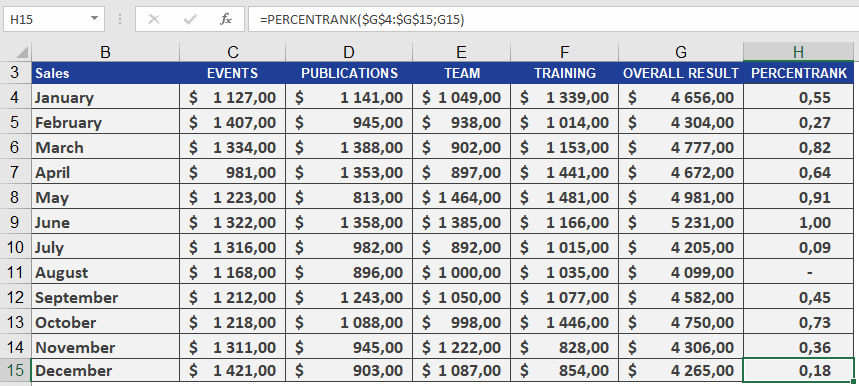
As the manager of the controlling department, you want to analyze the annual sales of all business units. Your goal is to determine the percentile rank of a given month’s sales compared to all monthly sales on a scale from 1 to 100, helping you assess sales variance.
Using PERCENTRANK(), you find that January’s sales of $4,656.00 have a quantile rank of 0.55. This means:
- The sales value ranks at 55on a scale of 1 to 100.
- 55%of all monthly sales are less than or equal to $4,656.00, while 45% are greater than or equal to this value (see Figure below).