This function returns the square of the Pearson correlation coefficient (r²) based on paired data points (known_y’s and known_x’s). The r² value represents the proportion of variance in the dependent variable (y) that can be explained by the independent variable (x).
Syntax:
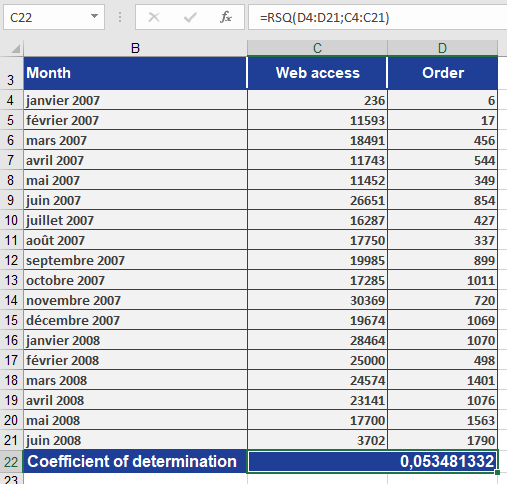
RSQ(known_y’s; known_x’s)
Arguments:
- known_y’s (required): An array or range of dependent data points (y-values)
- known_x’s (required): An array or range of independent data points (x-values)
Background:
RSQ() calculates the coefficient of determination (r²), which is the square of the Pearson correlation coefficient (r). This value indicates the strength of the linear relationship between two variables.
The coefficient of determination ranges between 0 and 1, where:
- 0 indicates no linear relationship
- 1 indicates a perfect linear relationship
The Pearson correlation coefficient (r) is calculated as:
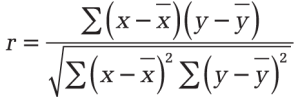
Where:
- x̄ and ȳ are the sample means (AVERAGE(x_values) and AVERAGE(y_values))
- RSQ() returns r² (r squared)
Important Notes:
- An r² value of 0.0354 suggests only 3.5% of the variation in y is explained by x
- While r² = 1 indicates a perfect linear fit, this does not imply causation
- Negative r² values are not possible and likely indicate an input error
Example:
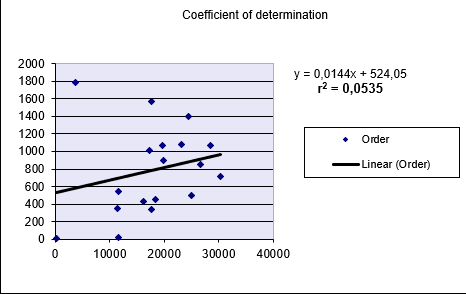
A software company analyzes the relationship between website visits (x) and online orders (y):
- Data is collected for both variables
- RSQ() calculation returns r² = 0.0535 (5.35%)
- Interpretation:
- Only 5.35% of order variation is explained by visit frequency
- This weak relationship is visually confirmed in Figure below