
This function returns the t-value of the t-distribution based on a given probability and degrees of freedom.
Syntax:
T.INV.2T(probability; degrees_freedom)
Arguments:
- probability (required) – The probability associated with the two-tailed Student’s t-distribution.
- degrees_freedom (required) – The number of degrees of freedom characterizing the distribution.
NOTE:
- If any argument is non-numeric, T.INV.2T() returns the #VALUE! error.
- If probability is < 0 or > 1, T.INV.2T() returns the #NUM! error.
- If degrees_freedom is not an integer, it is truncated. If degrees_freedom is < 1, the function returns #NUM!.
- T.INV.2T() returns the value t, such that P(|X| > t) = probability, where X is a random variable following the t-distribution, and P(|X| > t) = P(X < –t or X > t).
Key Points:
- A quantile of the t-distribution can be interpreted as the t-value of a one-tailed confidence interval. Due to the symmetry of the t-distribution, the t-value for a one-tailed interval can be calculated by replacing probability with 2*probability.
- For a probability of 0.05 and 10 degrees of freedom, the two-tailed t-value is calculated as:
=T.INV.2T(0.05, 10) → 2.28139. - The one-tailed t-value for the same parameters is:
=T.INV.2T(2*0.05, 10) → 1.812462. - If probability is specified, T.INV.2T() finds x such that T.DIST.2T(x, degrees_freedom, 2) = probability. Thus, its accuracy depends on T.DIST.2T().
- The function uses an iterative search technique. If convergence fails after 100 iterations, it returns #N/A.
Background:
The t-value (critical value) returned by T.INV.2T() is used as a test statistic for hypothesis testing. It helps evaluate the null hypothesis.
- Arguments:
- probability = significance level (calculable via T.DIST.2T()). For a one-tailed t-test, this level is doubled.
- degrees_freedom = (sum of both sample sizes) – 2.
Example:
A clinical study examines a drug’s efficacy:
- Group 1: Normal dosage.
- Group 2: Increased dosage (one participant dropped out).
- Goal: Determine if the higher dosage speeds up recovery (measured in days).
Hypotheses:
- Null (H₀): No difference in treatment success between groups.
- Alternative (H₁): Group 2 recovers faster due to more effective treatment.
Test Setup:
- One-tailed t-test (type 2) comparing two independent sample means.
- Significance level (α): 0.05.
- Critical value calculation: =T.INV.2T(2*0.05; degrees_freedom).
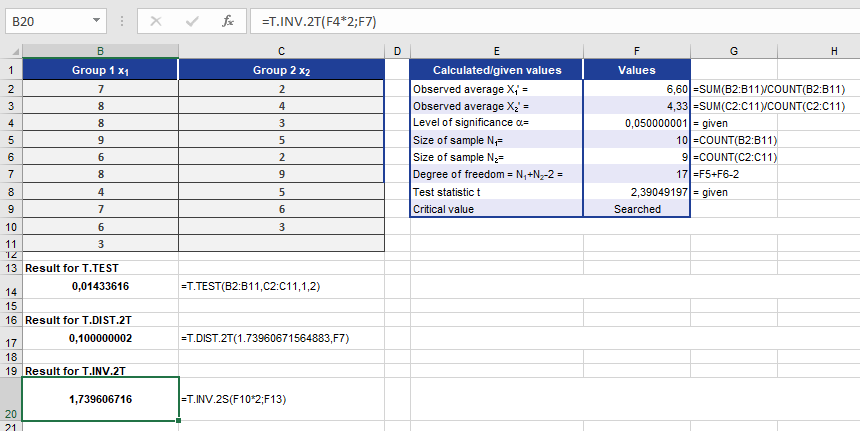
Result:
The critical t-value for the sample is 1.7396, which serves as a statistic to assess the null hypothesis.