To simplify the management and analysis of related datasets, you can convert a standard cell range into an Excel Table. Despite the generic name, Excel Tables are powerful tools packed with features that make your data easier to organize, analyze, and maintain over time. If you frequently update your datasets or require dynamic formulas that automatically adapt to new entries, then Excel Tables are exactly what you need.
Tables offer functionalities like sorting, filtering, automatic formatting, and more. It is generally recommended to format your data ranges as named Excel Tables to leverage these capabilities and additional advantages outlined below.
Advantages and Disadvantages of Excel Tables
Advantages
- Dropdown menus in header cells make sorting and filtering extremely convenient, allowing users to explore and extract insights quickly.
- Dynamic range: Excel Tables automatically expand or shrink when you add or remove rows, ensuring your data range always reflects the latest updates.
- Built-in styles allow you to quickly format tables for readability or presentation, without manual adjustments.
- Automatic filling of formulas and formatting: When you enter a formula in one row, Excel applies it to the entire column.
- Structured references: Instead of cell coordinates like A2:A10, formulas use column names (e.g., =SUM(Table1[Sales])), improving clarity and interpretability.
- Total row toggle: Easily enable a total row at the bottom of your table to calculate sums, averages, counts, and more without writing manual formulas.
- Seamless integration with PivotTables: Excel Tables are ideal sources for PivotTables, since they automatically adjust to include new data without requiring a manual update of the data source range.
Disadvantages
Despite their benefits, Excel Tables also have limitations, which may influence your decision depending on your workflow:
- Structured references lack absolute referencing, making it more difficult to copy formulas across columns without adjustments.
- Tables do not automatically expand on protected worksheets, even if the cells beneath are unlocked.
- Limitations with worksheet operations: You cannot group, copy, or move multiple sheets if at least one of them contains a table.
- Custom views cannot be created in workbooks that contain one or more Excel Tables.
Preparing Your Data for Table Conversion
Before converting a range into a formatted Excel Table, it is important to properly organize your data:
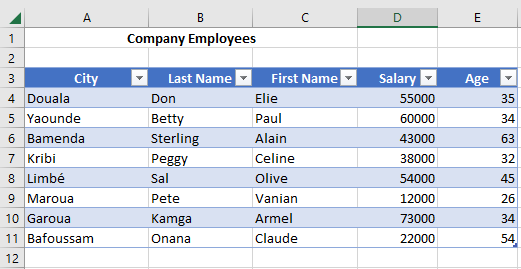
- Arrange your dataset in rows and columns, where each row represents a unique record (e.g., a customer order or inventory transaction).
- The first row should contain column headers, each with a short, descriptive, and unique title.
- Each column should contain consistent data types: one for dates, another for currencies, another for text, etc.
- Every row should include all the relevant details for a record. Ideally, use a unique identifier (like an order number) to avoid confusion.
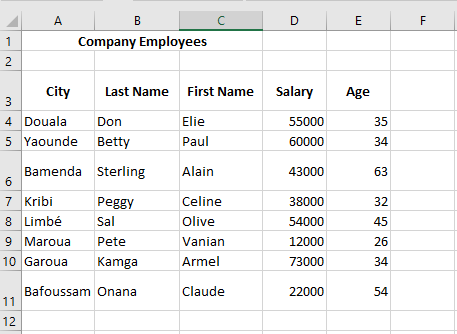
- Avoid empty rows or columns within the list, as they can interfere with Excel’s ability to define the table’s boundaries.
- Keep the dataset isolated from other data on the worksheet, preferably with at least one empty row and column separating it from other content.
Creating an Excel Table
Once your dataset is properly structured, follow these steps to convert it into an Excel Table:
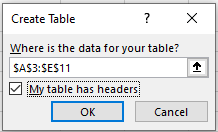
- Select any cell within your dataset.
- Go to the Insert tab on the ribbon.

- In the Tables group, click on the Table command.
- In the Create Table dialog box, Excel automatically identifies the range of your dataset. Make sure the “My table has headers” option is selected if your first row contains column names.
- Click OK to confirm. Your data is now formatted as an Excel Table.
Creating a Table Using Keyboard Shortcuts
You can quickly insert a table using keyboard shortcuts:
- CTRL + T or CTRL + L: Both shortcuts launch the Create Table dialog box.
- For a guided keyboard navigation: From the Home tab, press ALT, then H, then T, and use the arrow keys to select your desired table style. Press Enter to insert the table.
- From the Insert tab, press ALT, then N, then T to access the table insertion option.
Why CTRL + L?
While CTRL + T seems logical for creating a “Table,” CTRL + L is a legacy shortcut from Excel 2003, where formatted lists (not yet called « Tables ») were created using this shortcut. When Microsoft introduced the Ribbon in Excel 2007, they preserved older keyboard shortcuts (now called “Key Tips” or “Access Keys”) to maintain compatibility. In non-English versions of Excel, CTRL + L is sometimes the only functional shortcut, as CTRL + T may be reassigned to other functions.
Table Design Tools in Excel
After you create a Table, Excel reveals a new contextual ribbon tab labeled Table Design (or Table Tools > Design depending on the version). This tab only appears when a cell within the Table is selected. It gives access to various tools like:
- Changing the table name
- Enabling the total row
- Applying or modifying styles
- Adding banded rows or columns
- Managing table ranges
This dynamic behavior is also shared by other objects such as PivotTables, slicers, charts, and images—each of which activates contextual tabs when selected.