This function returns the average (arithmetic mean) of the arguments. To calculate the average, interval-scaled variables are summed and then divided by their count.
Syntax
AVERAGE(number1, number2, …)
Arguments
- number1 (required) and number2 (optional): At least one and up to 255 arguments (30 in Excel 2003 and earlier versions) for which you want to calculate the average.
Background
The arithmetic mean is the most well-known measure of central tendency and is widely used, even among non-statisticians. Because it incorporates all values in its calculation, it plays a key role in inferential statistics.
To compute the mean:
- Sum all values in a range.
- Divide the total by the number of values.
The arithmetic mean requires interval-scale data.
The combined mean of two datasets can also be derived from their individual arithmetic means.
Limitations
- Sensitivity to outliers: Extreme values significantly affect the mean since all data points are included.
- Potential misrepresentation: The mean may not align with actual observed values, especially in skewed distributions.
- Grouped data: For grouped or continuous variables, the arithmetic mean is only an estimate unless additional information about central tendency is available.
Applicability to Ordinal Data
Although the arithmetic mean typically requires metric-scale data, it can sometimes be applied to ordinal-scale data (e.g., customer satisfaction surveys) under certain conditions:
- The sample size is sufficiently large (n > 30).
- Data distribution approximates normality.
- A confidence interval is provided for the mean.
Comparison with Other Measures of Central Tendency
For datasets allowing arithmetic mean calculation, the mode and median can also be determined. The best measure depends on the context:
- Mean: Uses all data points but is sensitive to outliers.
- Median: Robust against outliers, ideal for skewed distributions.
- Mode: Best for categorical or highly clustered data.
Example
As a marketing manager for a software company, you need to calculate the average webpage visits in 2024 to identify high- and low-traffic areas.
Steps:
- Import website visit data into Excel.
- Use a PivotTable to organize visits by section (Products, Publications, Team, Training, Knowledge).
- Apply the AVERAGE() function to determine the mean visits per area.
Findings (see Figure below):
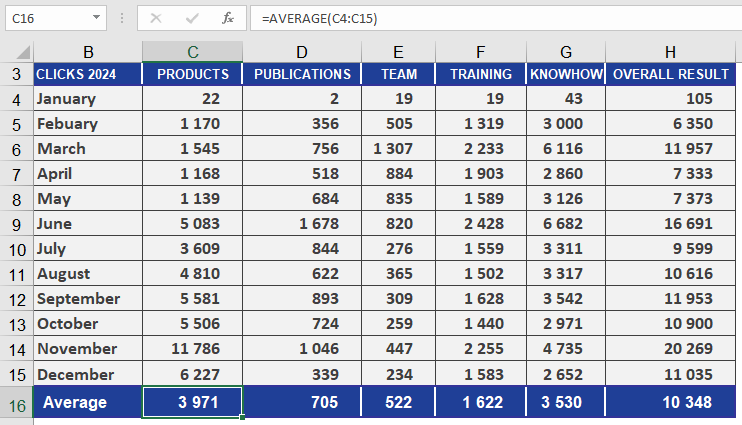
- The Products section has significantly more visits than Publications.
- The yearly average across all sections provides an overview of overall website activity.
- Comparing results with prior years enables trend analysis.