
This function calculates the margin of error for a confidence interval around a sample mean, assuming a normal distribution and a known population standard deviation. The confidence interval is:
Confidence Interval=xˉ±CONFIDENCE.NORM()
where:
- xˉ = Sample mean.
- The interval has a 100×(1−α)%100×(1−α)% confidence level (e.g., 95% for α=0.05α=0.05).
Syntax
CONFIDENCE.NORM(alpha; standard_dev; size)
Arguments
| Argument | Required? | Description |
| alpha | Yes | Significance level (e.g., 0.05 for 95% confidence). Must be between 0 and 1. |
| standard_dev | Yes | Population standard deviation (must be known). |
| size | Yes | Sample size (must be > 1). |
Background
- Key Concepts:
- Confidence Interval: A range where the true population mean is likely to fall.
- Margin of Error: CONFIDENCE.NORM() returns half the width of this range.
- Assumptions:
- Data is normally distributed.
- Population standard deviation (σσ) is known.
- Formula:
Margin of Error=zα/2×σnMargin of Error=zα/2×nσ
-
- zα/2zα/2 = Critical value from the standard normal distribution (e.g., 1.96 for 95% confidence).
- σ = Population standard deviation.
- n = Sample size.
- Interpretation:
- A 95% confidence interval means:
« If we repeated this experiment 100 times, ~95 of the calculated intervals would contain the true population mean. »
- A 95% confidence interval means:
Example: Website Traffic Analysis
Scenario
A software company analyzes monthly website visits and orders over 4 years (n=43n=43 months):
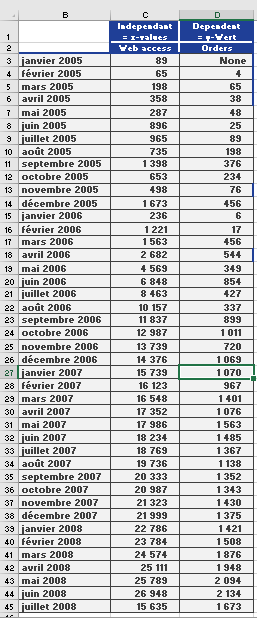
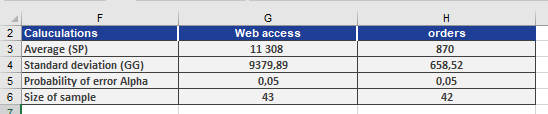
- Sample mean (xˉxˉ): 11,308.11 visits/month.
- Population standard deviation (σσ): 9,500 (assumed known).
- Confidence level: 95% (α=0.05α=0.05).
Step 1: Calculate Margin of Error
CONFIDENCE.NORM(0.05, 9500, 43) // Returns 2,803.57
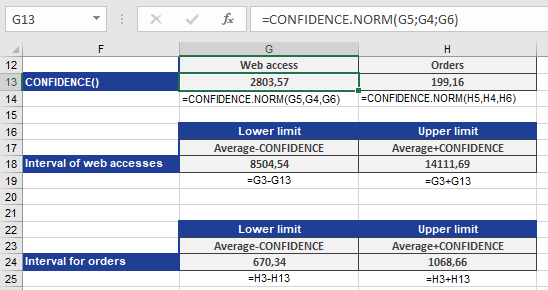
Step 2: Construct Confidence Interval
11,308.11±2,803.57=[8,504.54, 14,111.69]11,308.11±2,803.57=[8,504.54, 14,111.69]
Conclusion
- 95% Confidence Interval: [8,504.54, 14,111.69] visits/month.
- Interpretation: We are 95% confident the true population mean of monthly visits lies in this range.
Key Notes
- When to Use:
- Estimating population means when σ is known (rare in practice; consider CONFIDENCE.T() if σ is unknown).
- Quality control, market research, or any scenario requiring precision estimates.
- Limitations:
- Inaccurate for small samples: Requires n≥30n≥30 for reliable results unless data is perfectly normal.
- Misinterpretation Risk: A 95% CI does not mean there’s a 95% chance the true mean is in the interval (it’s fixed).
- Common Errors:
- #NUM! if:
- α≤0α≤0 or ≥1≥1.
- size≤1size≤1.
- #VALUE! if non-numeric inputs are provided.
- #NUM! if: