This function returns the covariance of two sets of values. Covariance helps determine the relationship between two datasets. For example, you can analyze whether an increase in online orders correlates with the number of website visits. To compute covariance, the deviations of all value pairs from their respective means are multiplied, and then the average of these products is taken.
Syntax
COVAR(array1; array2)
Arguments
- array1 (required): The first range of integer values.
- array2 (required): The second range of integer values.
Background
The covariance describes the correlation between two variables, *x* and *y*, in terms of direction (positive or negative). It indicates whether the relationship between the variables is direct or inverse. Covariance can take any real value.
Interpreting Covariance Results
- Positive covariance: Indicates a concordant linear relationship between *x* and *y*. High values of *x* correspond to high values of *y*, and low values of *x* correspond to low values of *y*.
- Negative covariance: Indicates an inverse linear relationship. High values of one variable correspond to low values of the other.
- Zero covariance: Suggests no linear correlation between *x* and *y*.
While covariance reveals the direction of the relationship, it does not measure the strength of the correlation. This is because covariance depends on the scale of the variables. For instance, a covariance of 5.2 meters would be 520 centimeters for the same data in a different unit.
Key Insights from Covariance and Standard Deviations
Given *n* pairs of values (x₁, y₁), (x₂, y₂), …, (xₙ, yₙ), with standard deviations sₓ and sᵧ and covariance sₓᵧ, the maximum possible covariance is the product of the standard deviations (sₓ × sᵧ). This upper limit occurs when the relationship between xᵢ and yᵢ is linear (i.e., y = a + bx).
The covariance is calculated as:
COVAR=∑(xi−xˉ)(yi−yˉ)nCOVAR=n∑(xi−xˉ)(yi−yˉ)
![]()
where:
- x̄ and ȳ are the sample means (AVERAGE(array1) and AVERAGE(array2)).
- n is the sample size.
Example
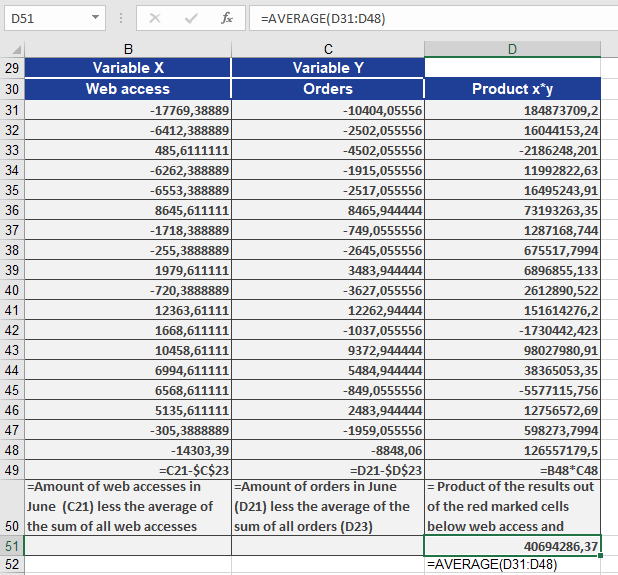
Consider a software company that sells products online and uses newsletters to boost sales. Last year, website orders increased significantly. To understand the reason, you first calculated the correlation coefficient. Now, you want to determine the direction of the relationship between website visits (*x*) and online orders (*y*) by computing the covariance.
The positive covariance confirms a concordant linear relationship—higher website visits correspond to higher orders, and lower visits correspond to fewer orders. This is further supported by a correlation coefficient of 0.89, indicating a strong linear relationship.
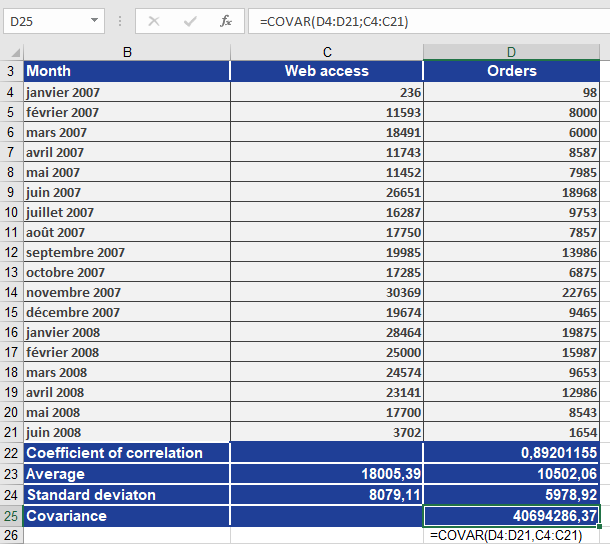
A manual calculation (without COVAR()) using the formula above yields the same result, as illustrated in the accompanying figures.