This function calculates the population covariance, which is the average of the products of deviations for each pair of data points. Covariance helps determine the relationship between two datasets. For example, you can analyze whether higher income levels correlate with higher education levels.
Syntax
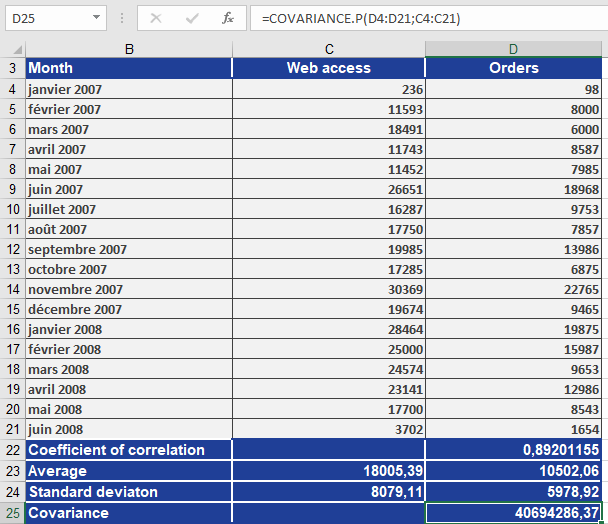
COVARIANCE.P(array1; array2)
Arguments
- array1 (required): The first range of integer values.
- array2 (required): The second range of integer values.
EXAMPLE
Key Notes
- Population vs. Sample: Unlike COVARIANCE.S (sample covariance), COVARIANCE.P calculates covariance for an entire population.
- Interpretation:
- Positive result: Indicates a direct relationship (as one variable increases, the other tends to increase).
- Negative result: Indicates an inverse relationship (as one variable increases, the other tends to decrease).
- Zero: Suggests no linear relationship.