This function estimates the standard deviation of a population based on a sample of data found in a column within a list or database that matches the specified conditions.
Syntax
DSTDEV(database; field; criteria)
Arguments
- database (required): The cell range that constitutes your list or database.
- field (optional): Indicates which column the function will use.
- criteria (required): The cell range containing the field names and the filter criteria.
Background
The standard deviation is a crucial measure of spread and quantifies the deviation from the arithmetic mean. It’s a measure of dispersion where a higher standard deviation indicates that the data is more spread out around the mean. The standard deviation is simply the square root of the variance.
Example
As a wholesaler, you’ve already analyzed your sales data using various functions. Now, you want to employ the DSTDEV() function to examine the dispersion of your sales. Specifically, you aim to understand how widely the sales orders for a particular product in a given country vary around the average order value.
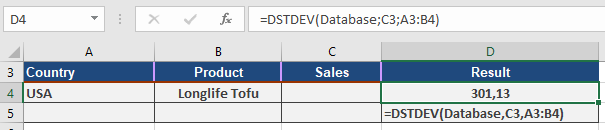
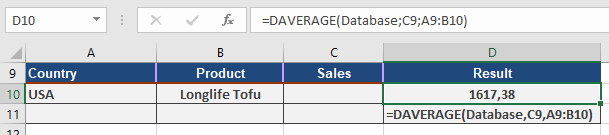
In Figures below, the standard deviation is calculated for orders of « Longlife Tofu » in the United States. The result indicates a standard deviation of $301.13 around the mean of $1,617.38. Figure also illustrates the calculation of the average.