
This function returns the test statistic of an F-test, which calculates the one-tailed probability that the variances of two datasets (array1 and array2) are not significantly different.
Syntax
F.TEST(array1; array2)
Arguments
- array1 (required): The first dataset (range or array).
- array2 (required): The second dataset (range or array).
Background
The F.TEST() function determines whether two samples exhibit different variances. For example:
- Compare test scores from public vs. private schools to assess differences in score variability.
- Evaluate whether the variance between two groups is statistically significant.
Key Notes:
- Purpose: Tests if two sample variances are equal.
- Output: Returns a significance level (p-value) between 0 and 1 (or 0%–100%).
- A high p-value (e.g., 0.89) suggests no significant difference in variances.
- A low p-value (e.g., <0.05) indicates significant differences.
- Calculation: Directly computes significance from raw data without pre-calculating variances.
Example: Clinical Drug Study
Scenario
- Goal: Test if an increased drug dosage speeds up recovery.
- Groups:
- Control group: Standard daily dosage.
- Test group: Higher initial dosage.
- Metric: Treatment duration (days).
Hypotheses
- Null (H₀): No difference in treatment efficacy.
- Alternative (H₁): Higher dosage improves recovery time.
Analysis
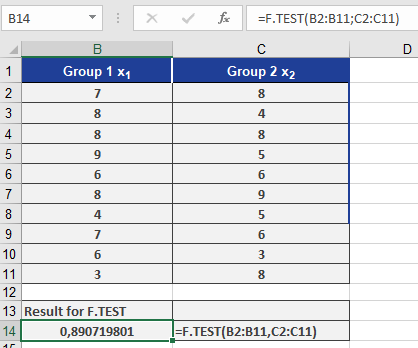
- F.TEST Result: 0.89 (89%) (see Figure below).
-
- Interpretation: 89% probability that variance differences are due to chance.
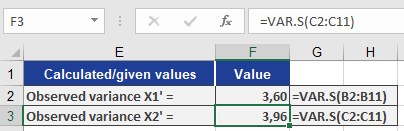
- Variance Comparison (Figure below):
- Minor differences between groups.
- Confirms H₀ (no significant variance difference).
Conclusion
- Retain H₀: No evidence that higher dosage alters recovery time variability.
Key Takeaways
- Use F.TEST() to compare variances of two datasets.
- High p-value (e.g., >0.05): Fail to reject H₀ (variances are similar).
- Low p-value (e.g., ≤0.05): Reject H₀ (significant variance difference).