The FISHER() function computes the Fisher transformation of a given value x. This transformation converts a correlation coefficient (which ranges between -1 and +1) into an approximately normally distributed variable, enabling statistical tests on correlation data.
Syntax
FISHER(x)
Arguments
- x (required): A numeric value between -1 and 1 (typically a correlation coefficient r) that you want to transform.
Background
Correlation vs. Regression
- Correlation (r) measures the linear relationship between two variables.
- Ranges from -1 (perfect negative correlation) to +1 (perfect positive correlation).
- 0 indicates no linear relationship.
- Regression describes how one variable predicts another, while correlation quantifies their association.
Why Use Fisher Transformation?
- Non-Interval Scaling:
- The difference between r=0.2 and r=0.4 is not equivalent to the difference between r=0.4 and r=0.6.
- Direct averaging of correlation coefficients is invalid.
- Normalization:
- The Fisher z-transformation converts skewed correlation data into a normal distribution, allowing:
- Hypothesis testing (e.g., « Is the correlation significant? »).
- Averaging multiple correlations.
- The Fisher z-transformation converts skewed correlation data into a normal distribution, allowing:
Formula
The Fisher transformation is calculated as:
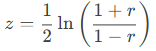
Where:
- r = Correlation coefficient.
- z = Transformed (normally distributed) value.
Steps to Average Correlations
- Transform each r to z using FISHER().
- Average the z-values.
- Revert the averaged z back to r using FISHERINV().
Example: Website Visits vs. Online Orders
Scenario
A software company (founded in 2005) analyzes website visits and online orders (2019–2022) to determine if marketing efforts (e.g., newsletters) drive sales.
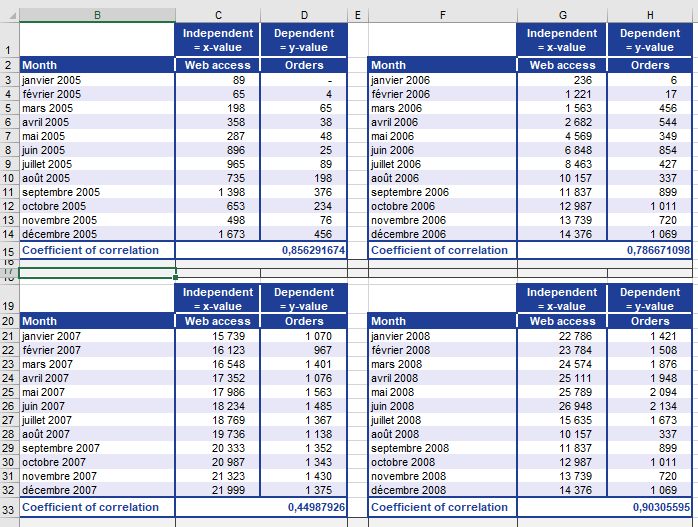
Data
- Yearly correlation coefficients (r) between visits and orders (Figure below).
- Problem: Cannot directly average r values (non-interval scaled).
Solution
- Transform r to z
- Use FISHER(r) for each year (Figure below).
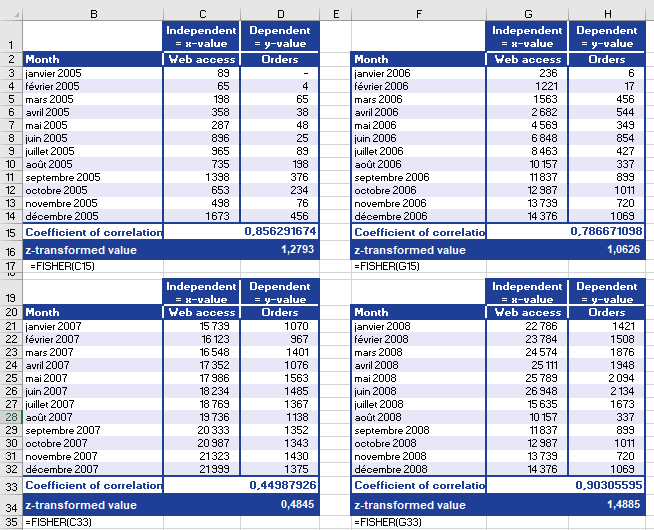
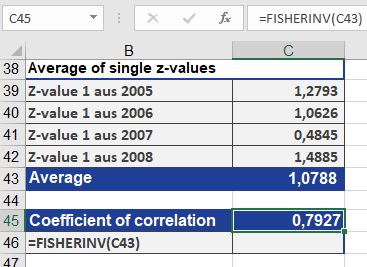
- Average z-values (Figure below).
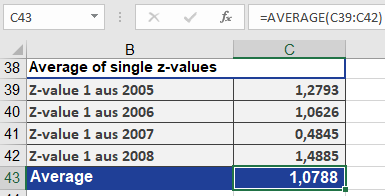
- Revert to r
- Apply FISHERINV(z_avg) → Final r = 0.7927 (Figure below).
Interpretation
- r = 0.7927: Strong positive correlation.
- As website visits ↑, online orders ↑.
- Conclusion: Marketing-driven visits significantly increase orders.
Key Takeaways
- Use FISHER() to:
- Normalize correlation data for statistical tests.
- Compute averages of multiple correlations.
- Use FISHERINV() to revert z back to r.
- Limitation: Only valid for -1 < r < 1.