The FORECAST() function predicts a future value (y) based on existing linear trends in your data. It uses linear regression to estimate the dependent variable (y) for a given independent variable (x).
Syntax
FORECAST(x; known_y’s; known_x’s)
When to Use
- Predict future sales, inventory needs, or consumer trends.
- Estimate values along a linear trendline.
Arguments
| Argument | Required | Description |
| x | Yes | The data point (independent variable) for which you want to predict a value. |
| known_y’s | Yes | The dependent data range (values you want to predict, e.g., sales numbers). |
| known_x’s | Yes | The independent data range (e.g., time periods, ad spend). |
Background
How It Works
- Fits a linear trend (y = mx + b) to your historical data (known_x’s, known_y’s).
- Predicts y for a new x value along this trendline.
Limitations
- Assumes a linear relationship between x and y.
- For non-linear trends, use GROWTH() (exponential) or TREND() (array-based).
Example: Predicting Website Visits & Online Orders
Scenario
As a marketing director, you want to forecast:
- Online orders based on predicted visits.
Forecast Online Orders
- x: Predicted visits (C32).
- known_y’s: D2:D31 (Orders from Jan 2005 – Jun 2008).
- known_x’s: C2:C31 (Historical visits).
Formula:
=FORECAST(C32, D2:D31, C2:C31)
Result: Predicts orders for July 2008 (Figure below).
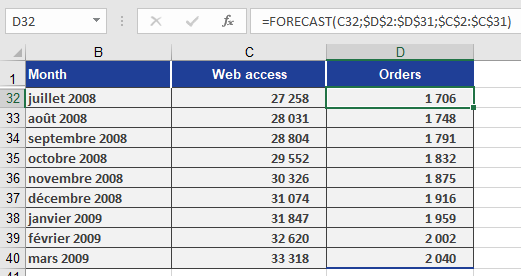
Copying the Formula
Use absolute references (e.g., $C$2:$C$31) to drag the formula across cells D33:D40 for future months.
Key Takeaways
Best for Linear Trends: Simple, fast predictions when data follows a straight-line pattern.
Not for Complex Trends: Use TREND() or GROWTH() for non-linear data.
Workflow:
- Organize historical x and y data.
- Apply FORECAST(x, known_y’s, known_x’s).
- Copy formulas for multiple predictions.