
This function returns a frequency distribution as a single-column matrix. For example, use FREQUENCY() to count sales within a specific range. Since FREQUENCY() returns an array of values, it must be entered as an array formula.
Syntax
FREQUENCY(data_array; bins_array)
Arguments
- data_array (required) – An array of or reference to a set of values for which you want to count frequencies. If data_array contains no values, FREQUENCY() returns an array of zeros.
- bins_array (required) – An array of or reference to intervals used to group the values in data_array. If bins_array contains no values, FREQUENCY() returns the number of elements in data_array.
Background
To simplify quantitative data analysis, values are categorized into classes, and their frequencies are calculated. Keep the following in mind:
- Too many classes provide more detail but reduce overall clarity, while too few classes oversimplify the data.
- Classes do not need to be of equal size.
Unlike the COUNTIF() function, FREQUENCY() does not require manual entry in each result cell. Instead, it can be entered once as an array formula, returning results across multiple cells.
Example
We’ll use the example of a software company’s sales data. A sales representative recorded monthly sales over two years in Excel. The manager wants sales categorized as:
- Up to $15,000
- Up to $17,000
- Up to $19,000
- More than $19,000
Thus, four classes are needed.
- The data to be classified is in cells C3:C26 (see Figure below).
- The class intervals are defined in the Class column.
- The frequency of data within each class is calculated based on these intervals.
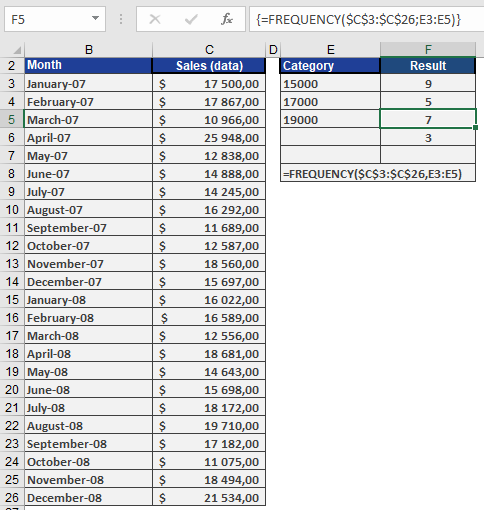
Since FREQUENCY() is an array function, select all four result cells (F3:F6) to display the output as an array.