This function returns probabilities for a hypergeometrically distributed random variable. It calculates the probability of obtaining a specific number of successes in a sample drawn from a finite population without replacement.
Syntax:
HYPGEOM.DIST(sample_s; number_sample; population_s; number_population; cumulative)
Required Information:
- Number of successes in the sample
- Size of the sample
- Number of possible successes in the population
- Size of the population
- Logical value determining the function type
Arguments
- sample_s (required): The number of successes in the sample.
- number_sample (required): The size of the sample.
- population_s (required): The number of successes in the population.
- number_population (required): The total size of the population.
- cumulative (required): A logical value that determines the function form:
- FALSE: Returns the probability mass function (exact probability).
- TRUE: Returns the cumulative distribution function.
Background
The hypergeometric distribution answers: « What is the probability of finding x successes in a sample drawn from a finite population? »
Key Characteristics:
- Used when sampling without replacement from a finite population.
- Each observation is either a success or failure.
- Subsets are chosen with equal likelihood.
Equation:
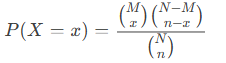
Where:
- x=sample_s
- n=number_sample
- M=population_s
- N=number_population
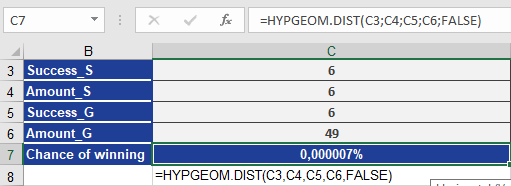
Example: Lottery Probability
Scenario: Calculate the probability of winning a lottery with 6 numbers drawn from 49.
Arguments:
- sample_s = 6 (winning numbers in ticket)
- number_sample = 6 (numbers drawn)
- population_s = 6 (total winning numbers)
- number_population = 49 (total balls)
- cumulative = FALSE (exact probability)
Calculations:
- Probability of 6/6 (Jackpot):
=HYPGEOM.DIST(6, 6, 6, 49, FALSE) → 0.00000715% (Figure below).
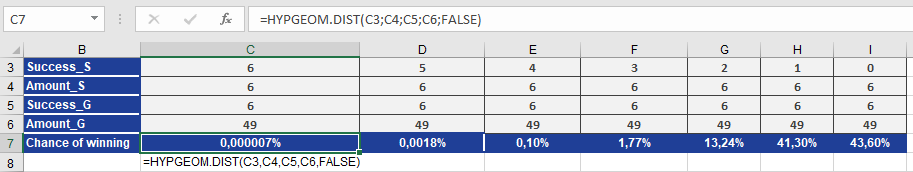
- Probabilities for Smaller Wins:
- 5/6: =HYPGEOM.DIST(5, 6, 6, 49, FALSE) → 0.0018%
- 4/6: =HYPGEOM.DIST(4, 6, 6, 49, FALSE) → 0.10%
- 3/6: =HYPGEOM.DIST(3, 6, 6, 49, FALSE) → 1.77% (Figure below).
Conclusion:
The hypergeometric distribution precisely models scenarios with finite populations and without replacement, such as lotteries or quality control testing.