This function calculates the exponential curve in regression analyses and returns an array of values describing this curve. Since it returns an array, it must be entered as an array formula.
Syntax:
LOGEST(known_y’s, known_x’s, const, stats)
Arguments:
- known_y’s(required): The known y-values from the relationship y = b * m^x.
- If known_y’sis a single column, each column in known_x’s is treated as a separate variable.
- If known_y’sis a single row, each row in known_x’s is treated as a separate variable.
- known_x’s(optional): The known x-values from the relationship y = b * m^x.
- The known_x’sarray can include one or more sets of variables. If only one variable is used, known_y’s and known_x’s can be ranges of any shape as long as they have equal dimensions. If multiple variables are used, known_y’s must be a single row or column (a vector).
- If known_x’sis omitted, it defaults to {1,2,3,…} with the same number of elements as known_y’s.
- const(optional): A logical value determining whether to force the constant b to equal 1.
- If constis TRUE or omitted, b is calculated normally.
- If constis FALSE, b is set to 1, and the m-values are adjusted so that y = m^x.
- stats(optional): A logical value specifying whether to return additional regression statistics.
- If statsis TRUE, LOGEST() returns additional statistics in the array format:
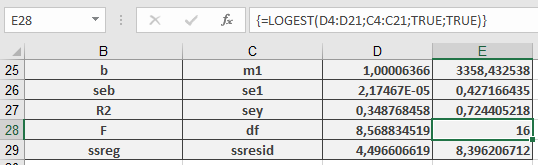
{mn, mn-1, …, m1, b; sen, sen-1, …, se1, seb; r², sey; F, df, ssreg, ssresid} - If statsis FALSE or omitted, LOGEST() returns only the m-coefficients and constant b.
- If statsis TRUE, LOGEST() returns additional statistics in the array format:
Background:
Unlike LINEST(), which fits a straight line, LOGEST() describes the relationship between dependent y-values and independent x-values using an exponential curve of the form:
y = b × m^x
Here, y and x can be vectors. Each base m has an associated exponent x, meaning references or values must have the same number of elements.
If only one independent x-variable exists, you can calculate:
- Slope (m): =INDEX(LOGEST(known_y’s, known_x’s), 1)
- y-intercept (b): =INDEX(LOGEST(known_y’s, known_x’s), 2)
Use the equation y = b * m^x to predict future y-values. Alternatively, the GROWTH() function can be used for estimation.
When using an array constant (e.g., values_x) as an argument, separate row values with commas and column values with semicolons.
Example:
To illustrate regression value calculations, consider the example used for LINEST(). A company observed a significant increase in online orders and wants to determine whether this growth correlates with website visits.
The marketing department analyzes past 18 months of data, comparing website visits to online orders using LOGEST() (see Figure below).
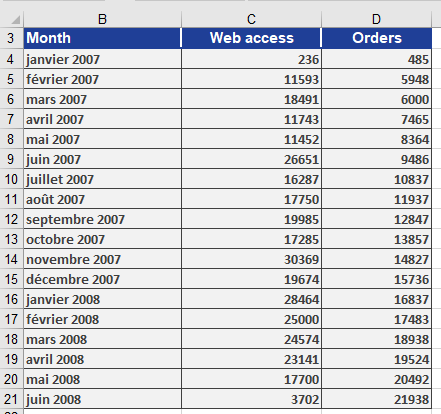
A chart (Figure below) shows that orders exhibit exponential growth relative to website visits, suggesting a strong correlation.

Using LOGEST(), the regression results are computed and displayed in Figure below.