Returns the most frequently occurring value in a dataset. If multiple values have the same highest frequency, it returns the first one encountered.
Syntax
MODE.SNGL(number1; [number2]; …)
Arguments
- number1 (required): First number, cell reference, or range
- number2,… (optional): Additional values/ranges
Key Features
- Data Handling:
- Only considers numeric values
- Ignores:
- Empty cells
- Text entries
- Logical values
- Returns #N/A if no duplicates exist
- Comparison with Other Measures:
| Measure | Returns | When to Use |
| MODE.SNGL | Most common value | Identifying frequent outcomes |
| MEDIAN | Middle value | Skewed distributions |
| AVERAGE | Arithmetic mean | Normally distributed data |
Example. You are the sales manager of the software company and want to evaluate the number of visits your sales representatives made in different regions numbered 1 through 5: Texas, Virginia, California, Oregon, and Washington. You have already created a table (see figure below).
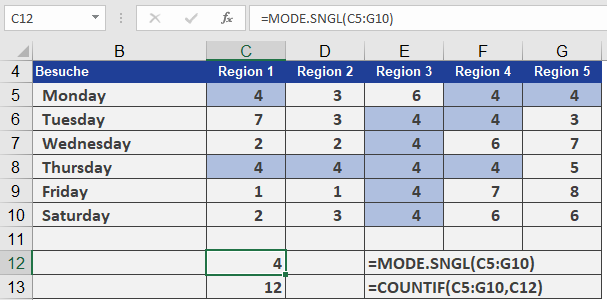
You want to know how many visits were usually necessary before a contract was signed. For this you use the MODE.SNGL() function.
Most of the time, it took four visits to get to the point where the customer signed the contract. If you nest the COUNTIF() and MODE.SNGL() functions, you can also count the number of modes in the range.