This function returns the normal distribution for a specified average value and standard deviation. It has broad applications in statistics, including hypothesis testing.
Syntax. NORM.DIST(x, mean, standard_dev, cumulative)
Arguments
- x (required): The distribution value (quantile) for which you want to calculate the probability.
- mean (required): The arithmetic mean of the distribution.
- standard_dev (required): The standard deviation of the distribution.
- cumulative (required): A logical value indicating the type of distribution:
- If TRUE, the function returns the cumulative distribution function (CDF).
- If FALSE, the function returns the probability density function (PDF).
Background.
Excel provides numerous statistical functions to calculate distributions and test hypotheses. One such function is NORM.DIST(). In general, distribution functions help answer probability-related questions.
For example, a coin toss has two outcomes: heads or tails.
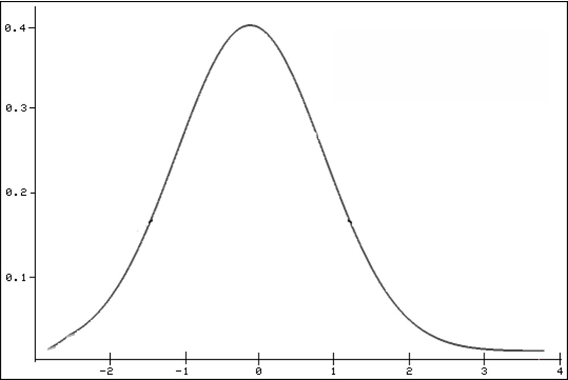
The NORM.DIST() function specifically returns the normal distribution of a given value. The normal distribution is the most important continuous probability distribution, indicating the probability of a random variable x. This distribution is also referred to as the Gaussian function, Gaussian bell, or bell curve, and is shown in Figure beow.
Mathematical Formula (for cumulative = FALSE):
The probability density function (PDF) of the normal distribution is:
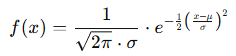
Where:
- x = value in the distribution (quantile)
- μ = mean (average)
- σ = standard deviation
- e = Euler’s number (approx. 2.71828)
If cumulative = TRUE, the formula computes the integral of the above expression from negative infinity up to xxx, yielding the cumulative probability.
Additional Notes on the Normal Distribution:
- It is bell-shaped.
- It is unimodal (has one peak).
- It is symmetrical around the mean.
- It asymptotically approaches the x-axis.
- The maximum occurs at the mean.
- 50% of values lie on either side of the mean.
- Mean, median, and mode are equal.
- Inflection points are located at μ±σ\mu \pm \sigmaμ±σ.
Excel provides both:
- A function ending in DIST to calculate the probability of a value.
- A function ending in INV to calculate the value for a given probability.
Example.
You’re a light bulb manufacturer analyzing bulb lifespans. You’ve determined:
- Mean (μ) = 2,000 hours
- Standard Deviation (σ) = 579 hours
You use NORM.DIST() to evaluate the probability that a bulb lasts:
- Up to 2,600 hours
- Only 1,400 hours
Use:
- cumulative = TRUE → for cumulative probability
- cumulative = FALSE → for exact probability (density)
So for:
- x=2,600x = 2,600x=2,600, NORM.DIST(2600, 2000, 579, TRUE)
- x=1,400x = 1,400x=1,400, NORM.DIST(1400, 2000, 579, TRUE)
- Exact: use the same x values, but set cumulative = FALSE.
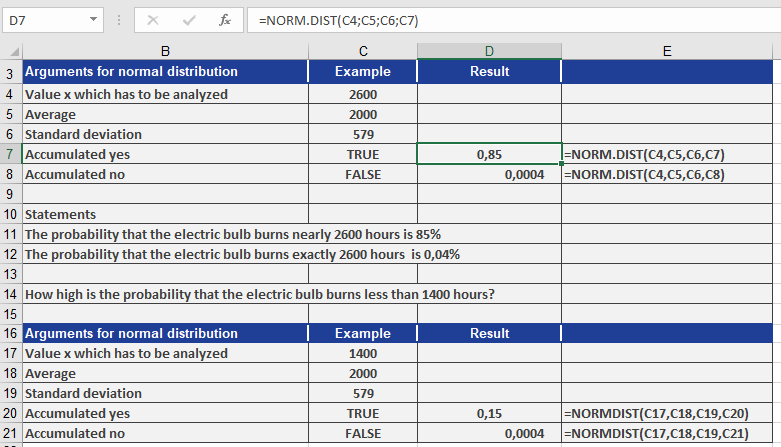
Conclusions from Figure above:
- The probability a light bulb works up to 2,600 hours: 85%
- The probability it works exactly 2,600 hours: 0.04%
- The probability it works only 1,400 hours: 15%
- The probability it works exactly 1,400 hours: 0.04%
With this method, you can:
- Perform hypothesis tests
- Calculate probabilities
- Determine value ranges for various confidence intervals