This function returns the quantile (inverse of the cumulative distribution) of a normal distribution for a given probability, mean, and standard deviation.
Syntax:
NORMINV(probability; mean; standard_dev)
Arguments:
- probability (required) – A probability value (0 ≤ *p* ≤ 1) associated with the normal distribution.
- mean (required) – The arithmetic mean (µ) of the distribution.
- standard_dev (required) – The standard deviation (σ) of the distribution.
Background:
A standard normal distribution has:
- Mean (µ) = 0
- Standard deviation (σ) = 1
Any normal distribution can be converted to a standard normal distribution using:
![]()
Conversely, a value () in a normal distribution can be derived from a z-score using:
x=μ+z⋅σ
For the standard normal distribution (see Figure below):
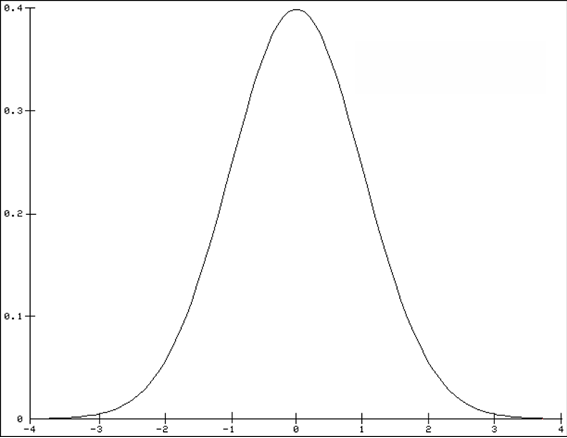
- 68% of values fall within ±1σ of the mean.
- 95.5% of values fall within ±2σ of the mean.
- 99.7% of values fall within ±3σ of the mean.
These same percentages apply to all normal distributions, regardless of µ and σ.
Example:
You are a light bulb manufacturer analyzing lifespan data:
- Mean (µ) = 2,000 hours
- Standard deviation (σ) = 579 hours
You want to find the lifespans for the top 85% and bottom 15% of bulbs.
Using NORMINV():
- 85th percentile: =NORMINV(0.85, 2000, 579) → ~2,600 hours
- 15th percentile: =NORMINV(0.15, 2000, 579) → ~1,400 hours
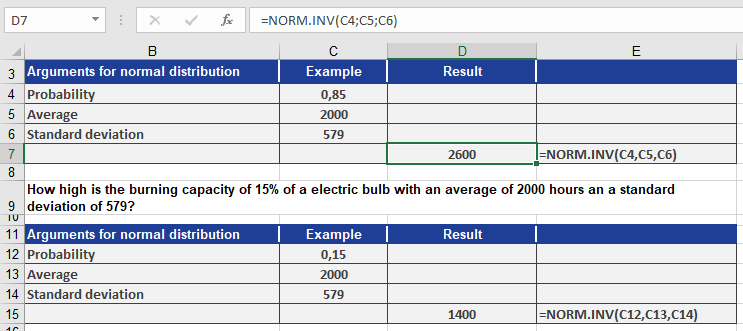
Interpretation (see Figure above):
- 85% of bulbs last up to 2,600 hours.
- 15% of bulbs last up to 1,400 hours.