Returns the alpha quantile (a threshold value) of a dataset, where alpha is a decimal between 0 and 1. This helps identify cutoff points (e.g., « Top 20% of sales »).
Syntax:
PERCENTILE(array; alpha)
Arguments:
- array (required) – The dataset (numeric range) to analyze.
- alpha (required) – The percentile (e.g., 0.8 for 80th percentile).
Background:
- Quantiles split data into ordered segments:
- Median = 0.5 quantile (50th percentile).
- Quartiles = 0.25, 0.5, 0.75 quantiles.
- Deciles = 0.1, 0.2, …, 0.9 quantiles.
- Calculation Rules:
- If n * alpha is not an integer, round up to the next data point.
- If n * alpha is an integer, interpolate between adjacent values.
(Example: For 16 data points, the 0.25 quantile falls between the 4th and 5th values.)
Example:
A software company analyzes annual sales across business units to identify top performers:
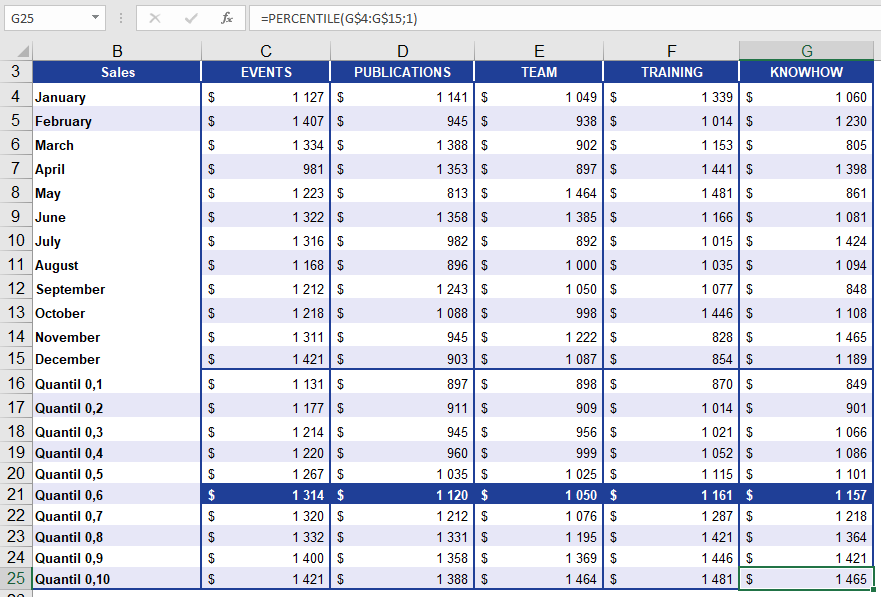
- 60% of sales values are below the returned threshold.
- 40% of sales values are at or above it.
Key Notes:
- Practical Use: Flag high-performing segments (e.g., « Invite customers above the 80th percentile to an event »).
- Limitation: Requires sorted data for manual validation.