This function calculates probabilities for a Poisson-distributed random variable. The Poisson distribution is commonly used to predict the frequency of rare, independent events over a specific interval (e.g., call center arrivals per hour or tire failures per 100,000 miles).
Syntax:
POISSON.DIST(x ; mean ; cumulative)
Arguments:
- x (required): The number of events to evaluate.
- mean (required): The expected average number of events (λ).
- cumulative (required): A logical value determining the calculation type:
- TRUE: Returns the cumulative probability (0 to *x* events).
- FALSE: Returns the exact probability for exactly *x* events.
Background:
Named after Siméon Denis Poisson (1781–1840), this distribution models rare events in large populations where:
- Events are independent (e.g., radioactive decay, customer arrivals).
- The average event rate (mean) is known but the actual occurrences are sporadic.
- The probability of an event is proportional to the interval length.
Key Properties:
- Approximates the binomial distribution for low-probability, high-sample scenarios.
- Requires only the mean (λ) as a parameter (unlike the binomial distribution).
- Assumes events are:
- Rare within the interval.
- Random and independent of prior events.
Formulas:
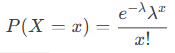
- Exact probability (cumulative = FALSE):
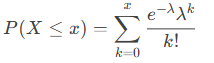
- Cumulative probability (cumulative = TRUE):
Example:
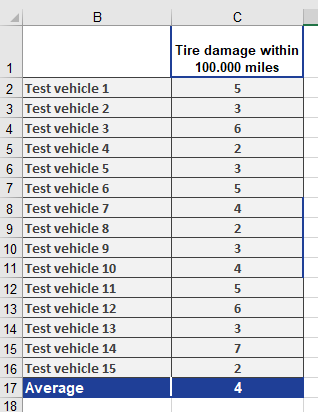
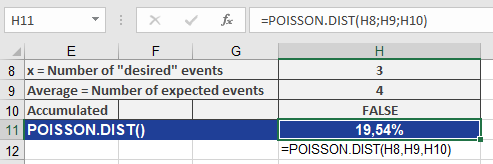
Scenario: A tire dealer observes an average of 4 damage incidents per 100,000 miles.
- Question: What is the probability of exactly 3 incidents?
- Inputs:
- x = 3, mean = 4, cumulative = FALSE
- Result: 19.54% (see Figure below).
- Inputs:
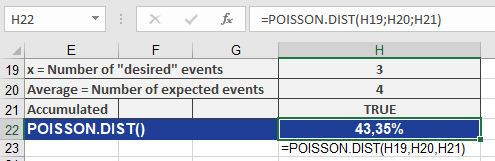
- Question: What is the probability of 0 to 3 incidents?
- Inputs:
- x = 3, mean = 4, cumulative = TRUE
- Result: 43.35% (see Figure below).
- Inputs: