Returns the specified quartile of a dataset. Quartiles divide data into four equal groups, useful for analyzing income distributions, sales performance, or survey results (e.g., identifying the top 25% of values).
Syntax:
QUARTILE(array ; quart)
Arguments
| Argument | Description |
| array (required) | Range of numeric values to analyze. |
| quart (required) | Integer (0–4) specifying which quartile to return. |
Table 1: Quartile Argument Values
| Value | Result |
| 0 | Minimum value |
| 1 | 25th percentile (lower quartile) |
| 2 | 50th percentile (median) |
| 3 | 75th percentile (upper quartile) |
| 4 | Maximum value |
Key Concepts
- Quartiles split data into 4 equal parts, while quantiles divide it into *n* parts.
- Median (quart=2) divides data into two equal halves.
- For datasets with even observations (e.g., 12 values), the median averages the middle two values.
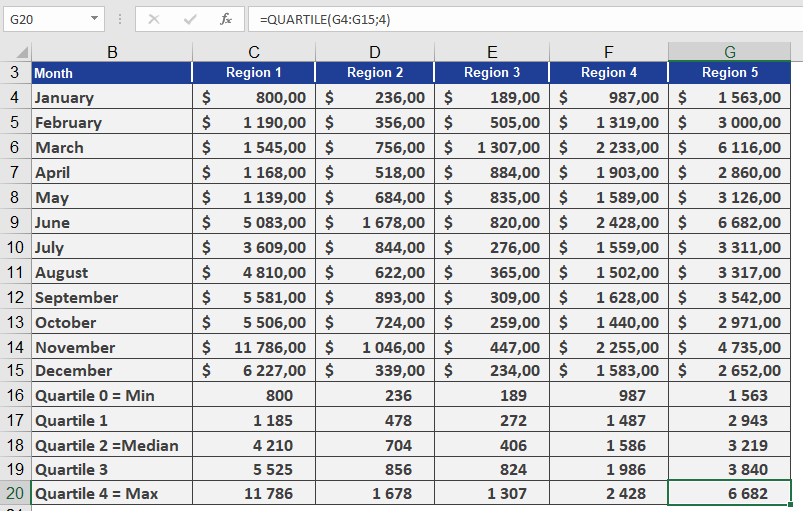
Pharmaceutical Sales Example
Goal: Analyze pill sales across 5 U.S. regions per 100,000 residents.
Data: 12 monthly sales values per region (sorted in ascending order).
Calculations for Region 1:
- Quartile 0 (Min): $800
- Quartile 2 (Median):
- Position: Between 5th/6th values → (4,200 + 4,220)/2 = $4,210
- Quartile 4 (Max): $11,786
Quartiles 1 & 3 (25th/75th Percentiles):
- Quartile 1 (25%): Between 3rd/4th values → $1,185
- Interpretation: 25% of sales ≤ $1,185.
- Quartile 3 (75%): Between 9th/10th values → $5,525
- Interpretation: 75% of sales ≤ $5,525.
Comparative Insight:
- In Region 5, 75% of sales are ≤ $3,840 (vs. $5,525 in Region 1).
Manual Calculation Notes
- For n=12:
- 25th percentile: 0.25×12 = 3rd/4th values → Weighted toward 4th.
- 75th percentile: 0.75×12 = 9th/10th values → Weighted toward 10th.
Visual Reference: See Figure below for sales data.