The SKEW() function returns the skewness of a distribution. Skewness measures the degree of asymmetry of a distribution around its mean.
- A positive skewness indicates a distribution with a tail that extends toward more positive values.
This is also referred to as a left-skewed distribution. - A negative skewness indicates a distribution with a tail that extends toward more negative values.
This is also called a right-skewed distribution.
Syntax:
SKEW(number1; [number2]; …)
Arguments
- number1 (required), number2 (optional):
At least one, and up to 255 arguments, representing the sample data.
You can input values individually, or use an array or cell reference.
Background
The SKEW() function calculates the skewness of a unimodal frequency distribution, focusing on how symmetric (or not) the data is around the mean.
Skewness is highly sensitive to outliers and extreme values.
In a normal (Gaussian) distribution, the skewness is 0, and the distribution is perfectly symmetrical about the mean.
In contrast:
- In a positively skewed distribution, the mean > median > mode
- In a negatively skewed distribution, the mean < median < mode
For a normal distribution:
- ~66% of data lies between the mean ± standard deviation
- The inflection points are at μ − σ and μ + σ
Formula
Skewness is defined as:
![]()
Where:
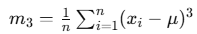 is the third central moment
- σ is the standard deviation
- μ is the mean of the distribution
Interpretation:
- If Skewness > 0, the distribution is right-skewed
- If Skewness < 0, the distribution is left-skewed
Example
A software company wants to analyze the click behavior on their website and its download area.
The marketing team uses the SKEW() function to evaluate the asymmetry in the number of clicks for:
- The download area
- The entire website
Results:
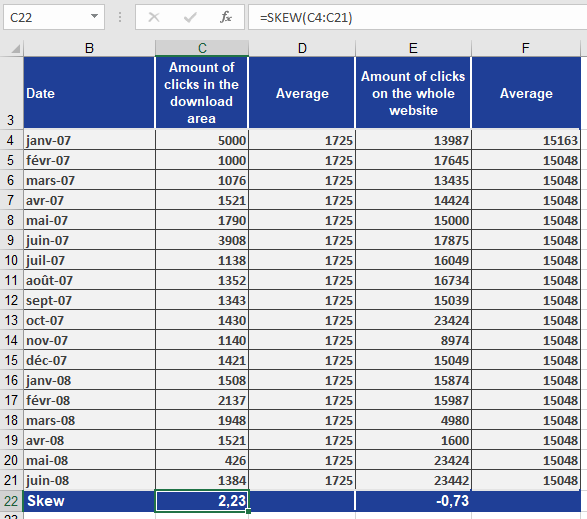
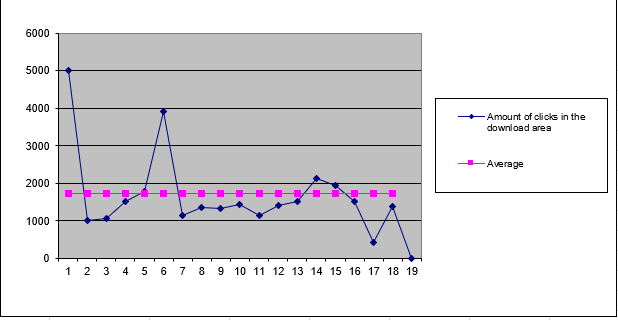
- Download area has a skewness of 2.23 → positively skewed
- This indicates the data is pulled toward higher values
- Also called left modal because the peak is on the left side of the chart
- See Figure below
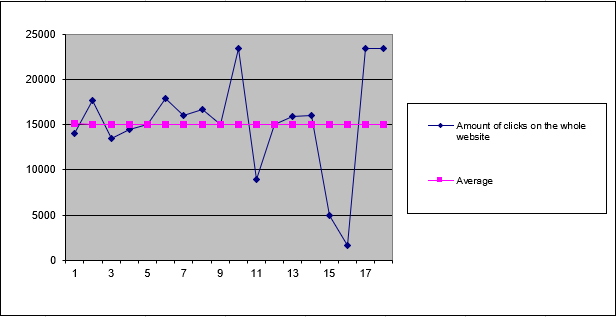
- Entire website has a skewness of -0.73 → negatively skewed
- This indicates the data is pulled toward lower values
- Also called right modal because the peak is on the right side of the chart
- See Figure below
Conclusion
The SKEW() function helps:
- Analyze distribution shape
- Detect asymmetry caused by outliers
- Compare actual data to a normal distribution