The SLOPE() function returns the slope of the linear regression line that best fits the data points in the arrays known_y’s and known_x’s.
The slope represents the rate of change — that is, the vertical change divided by the horizontal change between two points on the regression line.
Syntax:
SLOPE(known_y’s; known_x’s)
Arguments
- known_y’s (required): An array or cell range of dependent (response) variable values.
- known_x’s (required): An array or range of independent (predictor) variable values.
Background
The slope is a fundamental component in linear regression analysis. It helps determine how a change in the independent variable (x) influences the dependent variable (y).
A linear function has the general form:
yi=a+bxi
Where:
- a = y-intercept (the point where the line crosses the y-axis)
- b = slope of the line
- xi = individual x-values
- yi = corresponding y-values
- i=1,2,…,n
If both the intercept aaa and slope bbb are known, the function is fully defined. For example:
yi=2+0.4xi
In this case:
- The intercept is 2
- The slope is 0.4
- The line increases by 0.4 y-units for every increase of 1 x-unit
Formula
The slope of the regression line is calculated using the following formula:
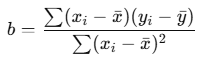
Where:
- xˉ=AVERAGE(x)
- yˉ=AVERAGE(y)
This is the formula used internally by the SLOPE() function.
Example
You are the marketing manager at a software company. You want to analyze how the number of website visits affects the number of online orders over the past 18 months.
After collecting the data, you apply the SLOPE() function to the visits and orders:
SLOPE(orders_range ; visits_range)
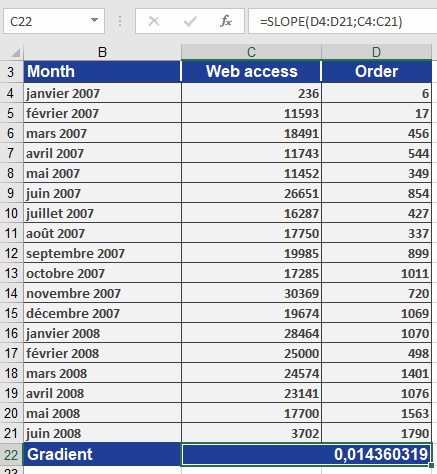
The result:
slope=0.0144\text{slope} = 0.0144slope=0.0144
This means:
- For each additional website visit, the number of orders increases by 0.0144
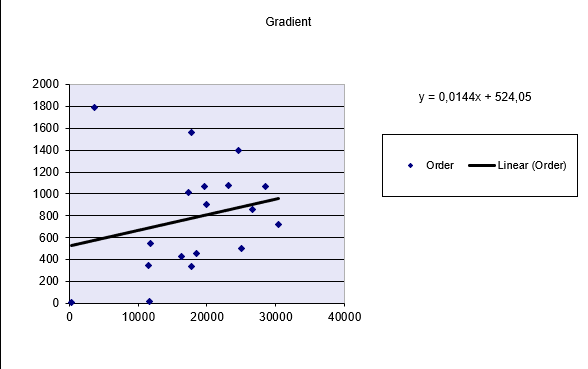
- In practical terms, if website visits increase by 100, the number of orders would increase by:
100×0.0144=1.44 orders100
The Figure below displays the regression line visually.
Conclusion
Use the SLOPE() function to:
- Calculate the rate of change between two variables
- Identify trends and relationships in data
- Create forecast models in combination with INTERCEPT(), FORECAST(), or LINEST()