The STANDARDIZE() function returns the standardized value (also called the z-score) of a data point from a distribution defined by a known mean and standard deviation.
A standardized value represents how far and in what direction a given value deviates from the mean, expressed in units of standard deviation.
Syntax:
STANDARDIZE(x; mean; standard_dev)
Arguments
- x (required): The data point you want to standardize
- mean (required): The arithmetic mean (average) of the distribution
- standard_dev (required): The standard deviation of the distribution
Background
In statistics, standardization transforms values from different scales into a common scale, typically with:
- Mean μ=0
- Standard deviation σ=1
This allows direct comparison between values from different distributions or datasets. The result is a standard normal distribution, a special case of the normal distribution where all values are expressed as z-scores.
This is based on the central limit theorem, which states that the sum of many independent, identically distributed random variables tends toward a normal distribution as the sample size increases.
Formula
The formula used by the STANDARDIZE() function is:
![]()
Where:
- x = observed value
- μ = mean of the distribution
- σ= standard deviation of the distribution
- z = standardized (z-score) value
Example
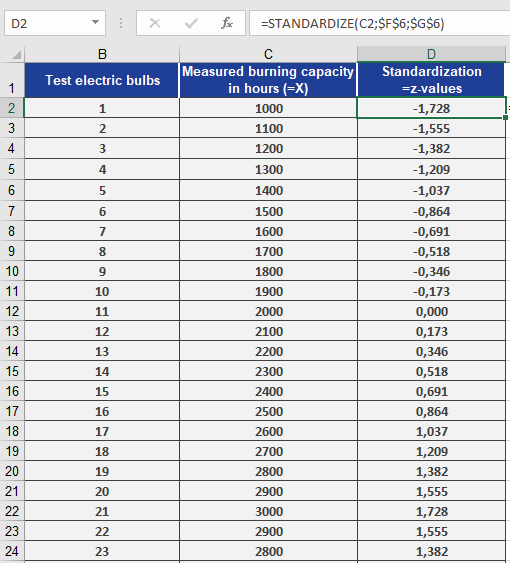
You’re a light bulb manufacturer analyzing the performance of your products. You’ve entered the measured lifespan values into an Excel table (Figure below).
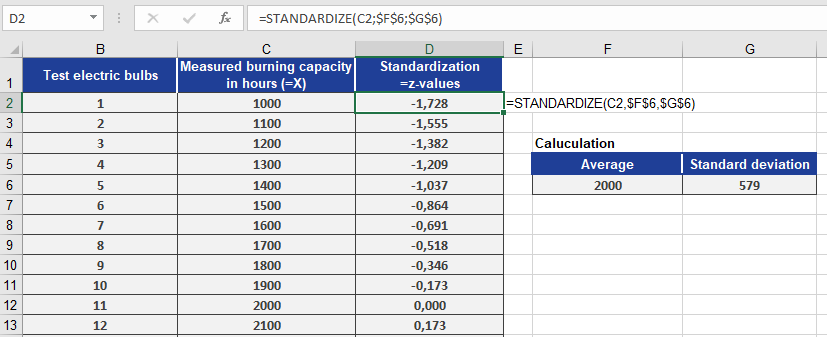
You’ve also calculated:
- Mean lifespan = 2,000 hours (mean = 2000) — cell F6
- Standard deviation = 579 hours (standard_dev = 579) — cell G6
Now, you want to standardize each measured value using:
STANDARDIZE(x, 2000, 579)
Where x refers to each measured bulb’s lifespan.
Figure below shows the resulting standardized values.
Conclusion
Using the STANDARDIZE() function, you can:
- Convert raw data into z-scores
- Identify how extreme or typical a value is
- Compare values from different distributions
- Prepare data for further statistical analysis like regression, clustering, or hypothesis testing
This function is especially useful in quality control, performance benchmarking, and data normalization tasks.