The STDEV.P() function calculates the standard deviation based on an entire population. The standard deviation is a statistical measure that quantifies how much values in a dataset deviate from the mean (average).
A low standard deviation indicates that values are close to the mean, while a high standard deviation suggests that values are spread out over a wide range.
Syntax:
STDEV.P(number1; [number2]; …)
Arguments
- number1 (required), number2 (optional):
Up to 255 numeric arguments representing the entire population.
You can input:- Individual values
- A cell range
- An array
Note:
- Text and logical values (e.g. TRUE, FALSE) are ignored.
- To include text and logical values, use the STDEVA.P() function instead.
Background
The only difference between STDEV.P() and STDEV.S() is the type of data they assume:
- **STDEV.P()** assumes you are working with the entire population
- **STDEV.S()** assumes you are working with a sample of the population
Thus, they use slightly different formulas.
Formula
The formula used by STDEV.P() is:
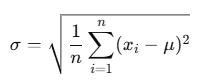
Where:
- σ = population standard deviation
- xi = each individual value
- μ = population mean (calculated using AVERAGE(number1, …))
- n = number of data points
This formula calculates the square root of the average squared deviations from the mean.
Example
Let’s return to the website evaluation by the software manufacturer (see Figure below).

You analyze the number of clicks in the PRODUCTS area over a time period and use the STDEV.P() function to measure how much the click data varies around the average.
- The result: 3,682.85
This means that the click counts typically deviate by about 3,682.85 from the average value.
If you square this result:
(3,682.85)2=Variance=VAR.P()
Thus, you can say:
- STDEV.P() gives you the standard deviation
- VAR.P() gives you the variance, which is the square of the standard deviation
Conclusion
Use STDEV.P() when:
- You are analyzing a complete population
- You want to understand the dispersion or variability of values
- You are comparing actual vs. expected behavior, such as in web analytics, manufacturing, or financial data