The STDEVA() function estimates the standard deviation based on a sample. It is used to measure how dispersed or spread out values are from their mean (average).
Unlike STDEV.S(), the STDEVA() function includes text and logical values in the calculation:
- Text is treated as 0
- FALSE is treated as 0
- TRUE is treated as 1
Syntax:
STDEVA(value1; [value2]; …)
Arguments
- value1 (required), value2 (optional):
- You can enter up to 255 arguments
- Arguments may be numbers, text, logical values, arrays, or cell references
Note:
To exclude text and logical values from the calculation, use STDEV.S() instead.
Background
Both STDEVA() and STDEV.S() use the same mathematical formula for standard deviation. However, they differ in how they treat non-numeric data.
Formula:
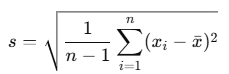
Where:
- s = sample standard deviation
- xi = each value in the dataset (including logic/text mapped to numeric values)
- xˉ = mean of the values
- n = number of items (including TRUE/FALSE/text as applicable)
Example
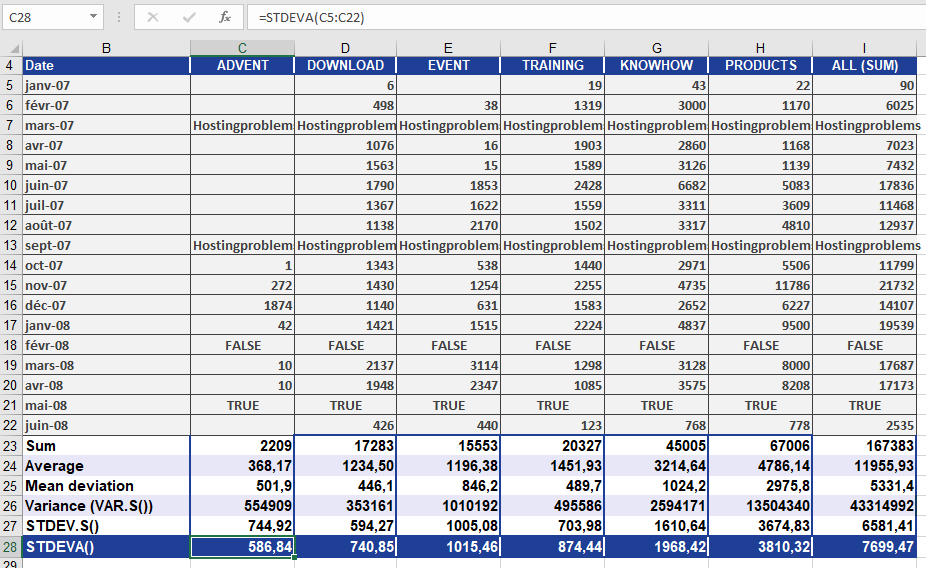
You’re analyzing monthly website visits over the past 18 months.
However, due to technical problems, the data includes:
- Text values (« hostingproblems ») for March and September 2007 (site was down)
- FALSE for February 2008 (site not accessible externally)
- TRUE for May 2008 (site accessed, but visits not recorded)
Figure below shows how this dataset looks.
Using STDEVA():
STDEVA(A2:A19)
The function includes:
- « hostingproblems » → 0
- FALSE → 0
- TRUE → 1
These values impact the mean and thus the standard deviation.
Result
In the PRODUCTS area:
- STDEVA() returns a result of 3,810.32, which means the data deviates from the mean by about 3,810.32 clicks.
- This is slightly higher than the result from STDEV.S(), because STDEVA() includes more « values » (text/logical), which reduce the mean and increase the spread.
Conclusion
Use STDEVA() when:
- Your dataset contains text or logical values
- You want those values to contribute to your statistical analysis
- You’re working with imperfect or semi-structured data (like logs, survey forms, or partial metrics)
If your dataset is strictly numeric, or you want to ignore non-numeric data, use STDEV.S() instead