
The STDEVPA() function calculates the standard deviation based on an entire population, including text and logical values in the calculation.
Standard deviation measures how spread out values are from the mean. It gives insight into the consistency or variability of your dataset.
Syntax:
STDEVPA(value1; [value2]; …)
Arguments
- value1 (required), value2 (optional):
- Up to 255 values (or 30 in Excel 2003 and earlier)
- Can be numeric values, text, logical values, cell references, or arrays
- Text is treated as 0
- Logical values:
- FALSE = 0
- TRUE = 1
Note: To exclude text and logical values, use STDEV.P() instead.
Background
The STDEVPA() function uses the same formula as STDEV.P(), but includes logical and text values in the calculation:
Formula:
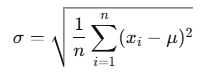
Where:
- σ = population standard deviation
- xi= each individual value (including 0 for text/FALSE, 1 for TRUE)
- μ = average (mean) of all values
- n = total number of values (including those derived from logical/text)
Example
Let’s revisit the website analysis example used for the STDEVA() function.
The software company experienced website data issues:
| Month | Issue | Marked As |
| March 2007 | Website down | « hostingproblems » (text → 0) |
| September 2007 | Hosting problem | « hostingproblems » (text → 0) |
| February 2008 | Access blocked | FALSE → 0 |
| May 2008 | Visits not recorded, but accessed | TRUE → 1 |
When applying STDEVPA() to the full set of visit data:
STDEVPA(A2:A19)
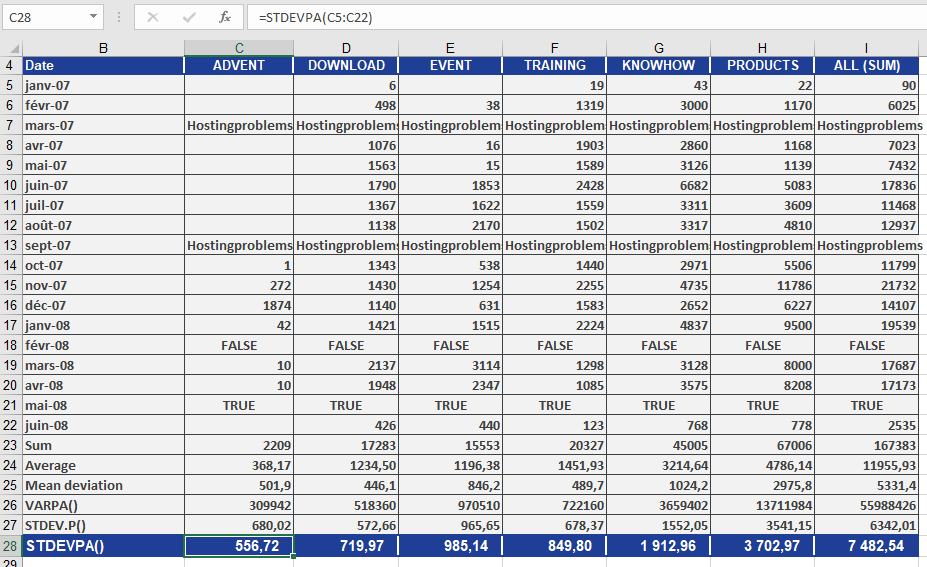
- The text and logical values are included, mapped to numeric values (as shown above).
- This leads to a different result than STDEV.P() which ignores non-numeric entries.
Result
In the PRODUCTS area:
- STDEVPA() returns 3,702.97, indicating the average deviation from the population mean, including the impact of text and logical values.
Compared to:
- STDEV.P(), which ignores these entries and thus returns a different (typically lower) value.
Conclusion
Use STDEVPA() when:
- You’re working with a complete population
- Your dataset includes text or logical values, and you want them included in your statistical analysis
- You’re handling semi-structured data, such as form responses, website logs, or datasets with missing months marked descriptively
If your data is fully numeric and clean, STDEV.P() is usually preferred.