
The STEYX() function calculates the standard error of the predicted y-values for each corresponding x-value in a linear regression.
This standard error quantifies the accuracy of the predictions — the smaller the standard error, the more reliable the regression model.
Syntax:
STEYX(known_y’s; known_x’s)
Arguments
- known_y’s (required): A range or array of dependent data points (output or response values)
- known_x’s (required): A range or array of independent data points (input or predictor values)
Important:
The order matters — known_y’s must come first.
Background
In statistics, the standard error represents the variation of a sample estimate (like a regression prediction) around the true population parameter. It is defined as the standard deviation of the sampling distribution.
- A small standard error implies that the predicted values are close to the true values
- A large standard error means there’s more uncertainty in the predictions
The standard error decreases as the sample size increases, approximately following this rule:
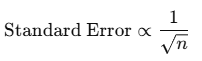
Where:
- n is the sample size
Thus, to halve the standard error, you’d need to quadruple the sample size.
Formula
The standard error of the predicted y-values is calculated using this general formula:
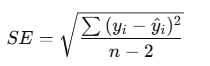
Where:
- yi = actual dependent value
- y^i = predicted y-value from the regression line
- n = number of data points
- The denominator n−2n – 2n−2 reflects the degrees of freedom in simple linear regression
Example
You’re a marketing manager at a software company. Your team records:
- Website visits (x-values) — independent variable
- Online orders (y-values) — dependent variable
Although the company is 10 years old, data from the last 2.5 years is available. You want to assess the reliability of using website visits to predict online orders.
You’ve entered both series into Excel as seen below.
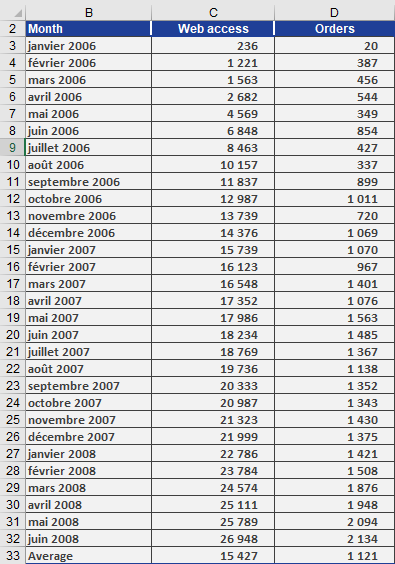
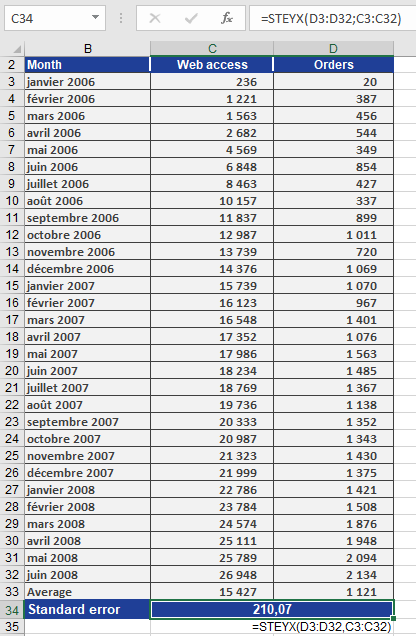
To find the standard error of the regression, use:
STEYX(Orders, Visits)
In your case:
- Mean of online orders yˉ=1,121\bar{y} = 1,121yˉ=1,121 (between July 2007 and June 2008)
- The function returns:
Result: 210.07
Interpretation
The value 210.07 means:
- On average, the predicted number of online orders deviates from the actual orders by about 210 orders.
- This indicates the expected margin of error in your predictions using the linear model.
Conclusion
Use the STEYX() function when:
- You’re performing linear regression
- You need to evaluate prediction accuracy
- You’re calculating confidence intervals or forecasting based on a known relationship between variables
The smaller the result, the tighter and more reliable your regression predictions will be.