
This function returns the two-tailed distribution (1 – α) of a Student’s t-distributed random variable. The t-distribution is used for hypothesis testing with small sample data sets. Use this function instead of a table of critical values for the t-distribution.
Syntax:
T.DIST.2T(x; degrees_freedom)
Arguments:
- x(required): The distribution value (quantile) for which you want to calculate the probability.
- degrees_freedom(required): An integer indicating the number of degrees of freedom.
Background:
The T.DIST.2T() function calculates the significance level (α-risk) of a t-distributed random variable. The probability of a hypothesis is evaluated based on this significance level.
The significance level calculation becomes particularly useful when you:
- Calculate the critical value for a sample, then
- Use DIST.2T()to determine the significance level for that critical value.
The result from T.DIST.2T() helps determine whether the null hypothesis holds.
Example:
A clinical study examines drug efficacy:
- Group 1:Standard daily dosage
- Group 2:Increased initial dosage
(One participant withdrew early for personal reasons)
Objective: Determine if the higher dosage accelerates recovery (measured in treatment days).
- Null Hypothesis (H₀):No difference in treatment effectiveness between groups.
- Alternative Hypothesis (H₁):Group 2 recovers faster due to more effective treatment.
A two-tailed, type 2 t-test (comparing means of independent samples) is conducted. T.DIST.2T() calculates the significance level for the critical value to evaluate the hypotheses.
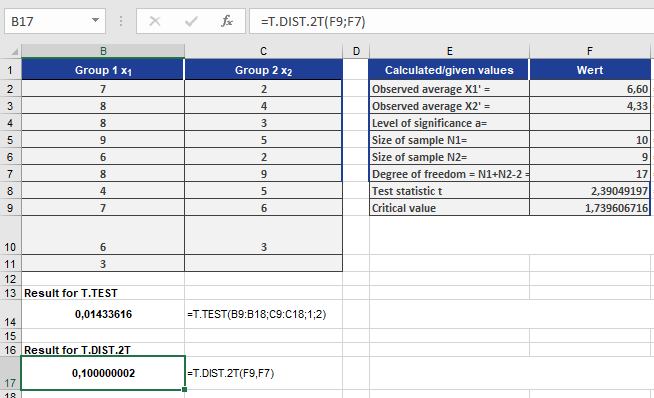
Result Interpretation:
If T.DIST.2T() returns 10% (0.1), this indicates:
- There’s a 10% probability that the null hypothesis is valid.
- Since this probability is small (typically <5% is considered significant), we reject the null hypothesis.