
The T.TEST() function returns the probability (p-value) associated with a Student’s t-test. It evaluates whether the means of two data sets are statistically different from each other. Use this function to determine if the two samples likely come from populations with the same mean.
Syntax
T.TEST(array1; array2; tails; type)
Arguments
- array1 (required):
First sample data set. - array2 (required):
Second sample data set. - tails (required):
Specifies the number of distribution tails:- 1 = One-tailed test
- 2 = Two-tailed test
- type (required):
Type of t-test to perform:- 1: Paired sample t-test
- 2: Two-sample equal variance (homoscedastic)
- 3: Two-sample unequal variance (heteroscedastic)
Background
The Student’s t-distribution is used when sample sizes are small and the population standard deviation is unknown. It is symmetrical and bell-shaped but has heavier tails than the normal distribution. It is parameterized by degrees of freedom.
The t-test determines the likelihood that the difference between sample means occurred by chance.
The general t-test formula is:
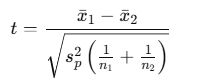
Where:
- xˉ1,xˉ2 are the sample means
- sp2s_p^2sp2 is the pooled variance (used if variances are equal)
- n1,n2 are sample sizes
Types of t-tests
- Paired Sample t-test (type = 1)
Used when the same subjects are measured twice (e.g., before and after treatment).
- Two-sample Equal Variance t-test (type = 2)
Used when two independent samples are assumed to have equal variances.
- Two-sample Unequal Variance t-test (type = 3)
Used when two independent samples have unequal variances.
Tails
- One-tailed test (tails = 1):
Tests if the mean of one sample is greater than or less than the other. - Two-tailed test (tails = 2):
Tests if the means are significantly different in either direction.
Hypotheses
One-tailed test:
- H0:μ1≤μ2
- H1:μ1>μ2
Two-tailed test:
- H0:μ1=μ2
- H1:μ1≠μ2
Example
A drug company runs a clinical study to test if a higher dosage of a treatment accelerates recovery. Two groups are observed:
- Group 1 receives the standard dosage
- Group 2 receives the increased dosage
You want to test the hypothesis that Group 2 recovers faster than Group 1.
You perform a one-tailed, two-sample equal variance t-test with:
T.TEST(array1, array2, 1, 2)
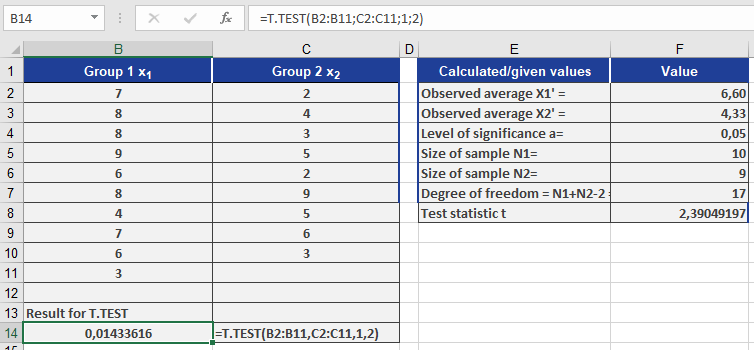
Assume the result is 0.014 (1.4%).
Interpretation
- The p-value = 0.014, which is less than the significance level α = 0.05.
- ⇒ Reject the null hypothesis.
- ⇒ There’s strong evidence that Group 2 recovers faster than Group 1.
Key Points
- If T.TEST() result < α (e.g., 0.05), the difference is statistically significant.
- The function outputs a probability, not a t-value.
- T.TEST() is more accurate and preferred over manual lookup of critical t-values.
Note: T.TEST() replaces the older TTEST() function in newer Excel versions, but both work the same.