
This function calculates the variance assuming that the entire data set represents the whole population.
Syntax. VAR.P(number1; number2; …)
Arguments
- number1 (required) and
- number2 (optional)
You can enter at least one and up to 255 numeric arguments, which represent the population data set.
Background
The only difference between VAR.P() and VAR.S() lies in how they treat the data set:
- VAR.P() calculates the population variance,
- while VAR.S() is based on a sample from the population.
This example focuses on VAR.P(). For more details about variance and the sample-based function, refer to the VAR.S() description.
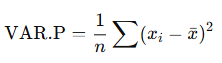
The formula used by VAR.P() is:
Where:
- xˉ is the population mean, calculated using AVERAGE(number1, number2, …)
- n is the total number of data points in the population
Example
Let’s return to the website analysis of the software company (see Figure below).
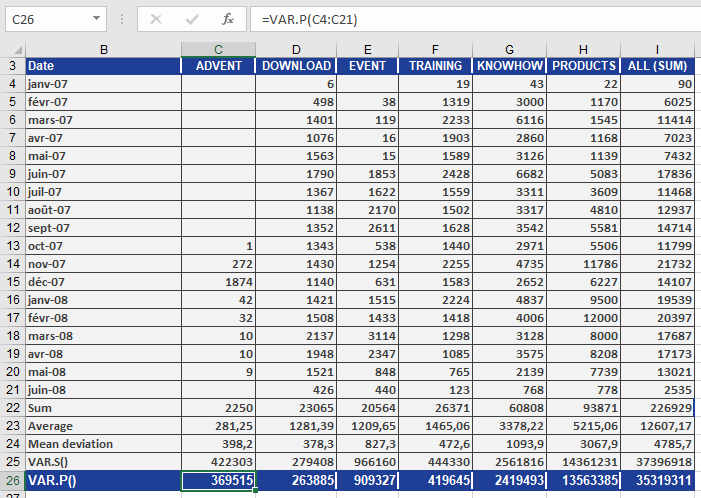
Since VAR.P() and VAR.S() use different formulas, they produce different results (as shown in Figure above).
Looking specifically at the DOWNLOAD data section, you can conclude the following:
The average squared deviation from the arithmetic mean (based on the entire population) is 263,885.