
This function estimates the variance based on a sample of the population. VAR.S() measures how the data points are distributed around the mean.
Syntax. VAR.S(number1; number2; …)
Arguments
- number1 (required) and
- number2 (optional)
You can enter at least one and up to 255 numeric arguments, which represent a sample of the population.
Background
In statistics, the two most commonly used measures of data spread are variance and standard deviation.
- Variance quantifies the average squared deviation of a variable x from its expected value E(x).
- This result is known as the empirical variance.
There are two types of variance:
- Population variance: Measures the spread within an entire population. Use the function VAR.P() for this.
- Sample variance: Measures the spread within a sample from a population. This is commonly used in descriptive statistics to describe data spread and in inferential statistics to estimate population variance. Use the function VAR.S() for this.
When working with a sample, the sum of the squared deviations is divided by (n – 1) instead of n to correct for bias.
VAR.S() uses the following formula:
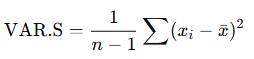
Where:
- xˉ is the sample mean, calculated by AVERAGE(number1; number2; …)
- n is the number of data points in the sample
Note: Squaring the deviations gives more weight to extreme values, which may influence the result.
A key limitation of variance is that it uses squared units, which differ from the original data units. For this reason, the standard deviation, which is the square root of the variance, is often used for interpretation.
Example
Because sample variance reflects how widely data points are spread, it is widely used in descriptive statistics.
In this example, the marketing department of a software company uses the VAR.S() function to analyze website visit data. The objective is to gain clearer insights and improve performance across different sections of the site.
Important: The analyzed data represents a sample — although the website has been online for a long time, the analysis only includes data from 18 months (January 2007 to June 2008).
As shown in Figure below, the department calculates the variance, the mean, and the average deviation.
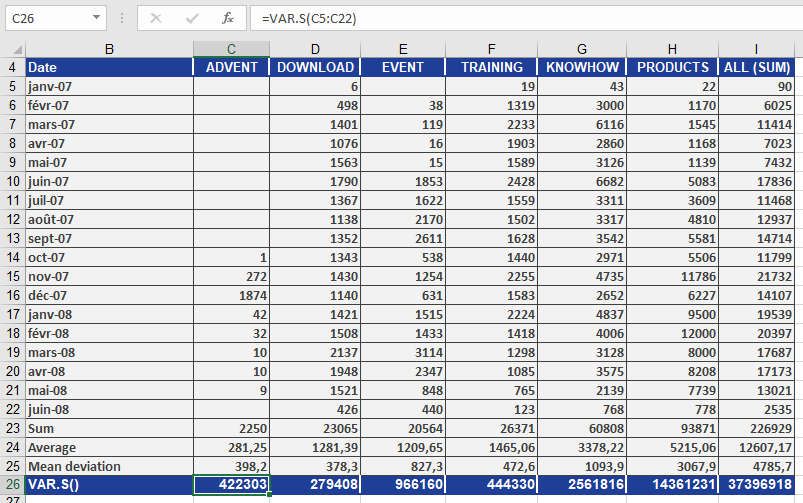
By examining the DOWNLOAD section, you can make the following statement:
The average squared deviation from the arithmetic mean for the DOWNLOAD area is 279,408.