
This function estimates the variance based on a sample. Unlike VAR.S(), VARA() includes numbers, text, and logical values (TRUE/FALSE) in the calculation.
Syntax. VARA(value1; value2; …)
Arguments
- value1 (required) and
- value2 (optional)
You can enter at least one and up to 255 values (limited to 30 in Excel 2003 and earlier), which make up a sample from the population.
Background
The only distinction between VARA() and VAR.S() is that VARA() includes text and logical values in its computation. For this reason, the focus here is on VARA().
VARA() uses the same formula as VAR.S():
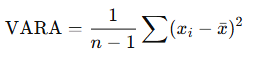
Where:
- xˉ is the sample mean, calculated as AVERAGE(value1; value2; …)
- n is the total number of values in the sample
In VARA(), text entries and the logical value FALSE are treated as 0, and TRUE is treated as 1.
Example
Let’s revisit the evaluation of website visits. Over the past 18 months, the company experienced technical issues that affected visit tracking. Specifically:
- In May 2007 and August 2007, hosting problems caused the website to be unavailable. These months are marked with the text « hostingproblems ».
- In March 2008, changes to the product section restricted access. This is represented by the logical value FALSE.
As shown in Figure below, the VARA() function returns a different result from VAR.S()—this is because VARA() incorporates both text and logical values in its variance calculation.
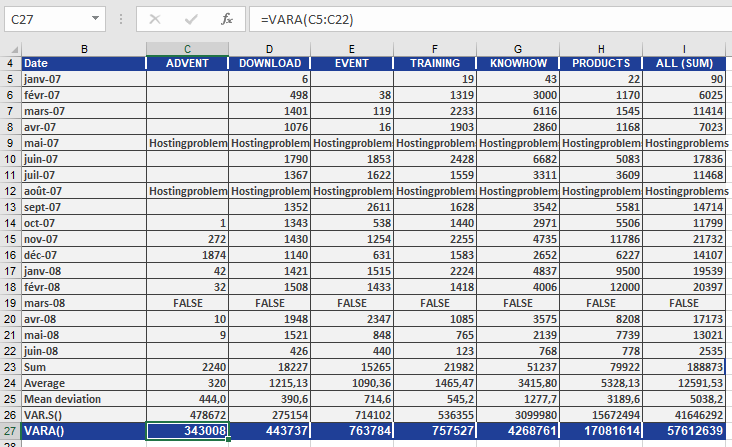
In this case:
- The text values (« hostingproblems ») and the logical value FALSE are both counted as 0 in the calculation.
By examining the DOWNLOAD section, the result can be summarized as follows:
The average squared deviation from the mean—including text and logical values—is 443,737 for the DOWNLOAD area.