Implementing advanced data prediction models in Excel using VBA can involve a variety of approaches, including regression analysis, time series forecasting, and machine learning techniques. In this detailed guide, I will walk you through how to implement a prediction model using Excel VBA, focusing on a simple linear regression model as an example. This type of model is commonly used for predicting a dependent variable based on the values of one or more independent variables.
Key Steps in the Process
- Prepare the Data:
- Ensure that your data is structured properly (independent variables in one column, dependent variable in another column).
- Implement the Model Using VBA:
- Write VBA code to calculate regression coefficients (slope and intercept).
- Use these coefficients to make predictions.
- Evaluate the Model:
- Measure the accuracy of the model using metrics like R² (coefficient of determination).
Step-by-Step Explanation
- Prepare the Data in Excel
For this example, let’s assume you have two columns in Excel:
- Column A: Independent variable (X)
- Column B: Dependent variable (Y)
For instance, your data might look like this:
| X (Independent Variable) | Y (Dependent Variable) |
| 1 | 2 |
| 2 | 3.8 |
| 3 | 5.1 |
| 4 | 6.2 |
| 5 | 7.8 |
- VBA Code to Implement Linear Regression
In this section, we will create a simple linear regression model that calculates the equation of the line Y=mX+bY = mX + b, where:
- mm is the slope (coefficient of the independent variable X),
- bb is the intercept (constant term).
Here is the VBA code that implements this:
VBA Code for Linear Regression
Sub LinearRegression()
    Dim XRange As Range
    Dim YRange As Range
    Dim XMean As Double, YMean As Double
    Dim Slope As Double, Intercept As Double
    Dim SSxy As Double, SSxx As Double
    Dim PredictedY As Double
    Dim LastRow As Long
    Dim i As Long
    ' Define your data range
    LastRow = Cells(Rows.Count, 1).End(xlUp).Row ' Assuming data starts in Row 1
    Set XRange = Range("A2:A" & LastRow) ' Independent variable (X)
    Set YRange = Range("B2:B" & LastRow) ' Dependent variable (Y)
    ' Calculate means
    XMean = Application.WorksheetFunction.Average(XRange)
    YMean = Application.WorksheetFunction.Average(YRange)
    ' Calculate the sum of squares for X and Y
    SSxy = 0
    SSxx = 0
    For i = 1 To LastRow - 1
        SSxy = SSxy + (XRange.Cells(i, 1).Value - XMean) * (YRange.Cells(i, 1).Value - YMean)
        SSxx = SSxx + (XRange.Cells(i, 1).Value - XMean) ^ 2
    Next i
    ' Calculate slope (m) and intercept (b)
    Slope = SSxy / SSxx
    Intercept = YMean - Slope * XMean
    ' Output the results
    MsgBox "The regression equation is: Y = " & Round(Slope, 2) & "X + " & Round(Intercept, 2)
    ' Make predictions for new X values (for example, X = 6)
    PredictedY = Slope * 6 + Intercept
    MsgBox "Predicted Y for X = 6: " & PredictedY
End Sub
How the Code Works:
- XRange and YRange: These variables define the ranges for the independent and dependent variables.
- XMean and YMean: These are the means of the X and Y data, which are used to calculate the slope.
- SSxy and SSxx: These are the sum of products of deviations and sum of squares of deviations, which are needed to calculate the slope.
- Slope and Intercept: Using the formulas for simple linear regression:
- m=∑(Xi−Xˉ)(Yi−Yˉ)∑(Xi−Xˉ)2m = \frac{\sum (X_i – \bar{X})(Y_i – \bar{Y})}{\sum (X_i – \bar{X})^2}
- b=Yˉ−m×Xˉb = \bar{Y} – m \times \bar{X}
- Prediction: The code calculates a predicted Y value for a given X value, using the formula Y=mX+bY = mX + b.
- Running the Code
To run the code:
- Open Excel and press ALT + F11 to open the VBA editor.
- Insert a new module by going to Insert > Module.
- Copy and paste the code into the module.
- Press F5 to run the macro.
Once the macro runs, you will see the regression equation in a message box, and you will also get a predicted Y value for X = 6.
- Evaluate the Model (R²)
To evaluate the accuracy of the regression model, you can compute the coefficient of determination (R²), which tells you how well the independent variable(s) explain the variance in the dependent variable.
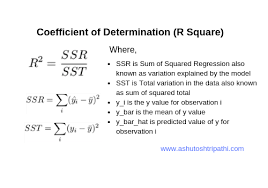
You can add a code block to calculate this R² value.
Example Code for R²:
' Calculate R² value
Dim SSresidual As Double
Dim SStotal As Double
Dim R2 As Double
' Calculate residual sum of squares (SSresidual) and total sum of squares (SStotal)
SSresidual = 0
SStotal = 0
For i = 1 To LastRow - 1
    ' Predicted Y for current X
    PredictedY = Slope * XRange.Cells(i, 1).Value + Intercept
    ' Sum of squares of residuals (observed Y - predicted Y)²
    SSresidual = SSresidual + (YRange.Cells(i, 1).Value - PredictedY) ^ 2
    ' Total sum of squares (observed Y - mean Y)²
    SStotal = SStotal + (YRange.Cells(i, 1).Value - YMean) ^ 2
Next i
' Calculate R²
R2 = 1 - (SSresidual / SStotal)
MsgBox "The R² value is: " & Round(R2, 4)
Interpreting the Model
- Slope: This represents the change in Y for each unit change in X.
- Intercept: This represents the value of Y when X = 0.
- R²: A higher R² (close to 1) means that the model explains most of the variance in the dependent variable.
Conclusion
This guide gives a basic but powerful example of how to implement a data prediction model using linear regression in Excel VBA. It demonstrates the steps to:
- Prepare the data,
- Write VBA code for regression analysis,
- Evaluate the model’s accuracy with R².
For more complex models (like multiple regression, time series forecasting, or machine learning), you would extend this approach by incorporating more variables, different formulas, or external libraries, such as integrating Python with Excel (using Power Query or Excel Python add-ins) to handle more advanced computations.