Worksheets with a large amount of data can often appear cluttered and difficult to understand. Fortunately, Microsoft Excel provides a powerful Subtotal feature that allows you to quickly summarize different groups of data and create an outline for your worksheets.
What Is a Subtotal in Excel?
Generally speaking, a subtotal is the sum of a set of numbers, which is then added to one or more other sets to form a grand total. In Microsoft Excel, the Subtotal feature is not limited to summing subsets of values in a dataset. It lets you group and summarize your data using SUM, COUNT, AVERAGE, MIN, MAX, and other functions.
In addition, it creates a hierarchy of groups, known as an outline, which enables you to show or hide details for each subtotal, or just view a summary of the subtotals and grand totals.
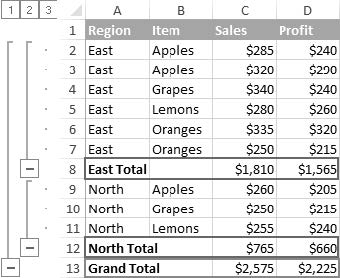
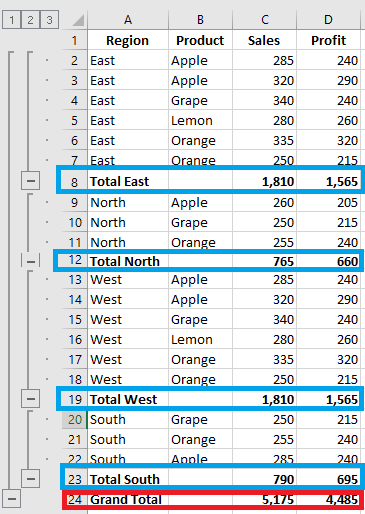
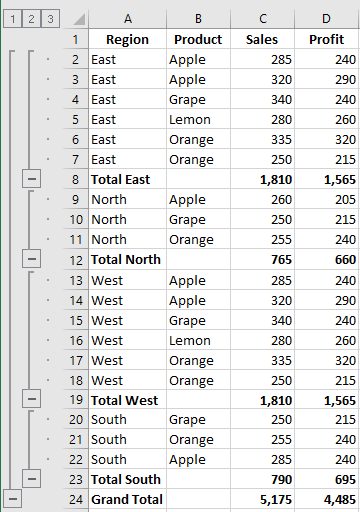
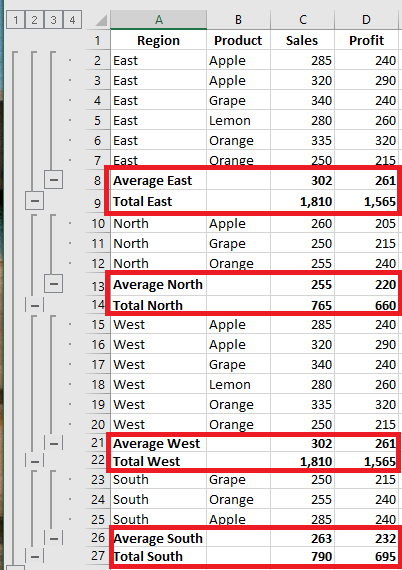
For example, here’s what Excel subtotals might look like:
To quickly insert subtotals in Excel, follow these steps:
Organize the Source Data
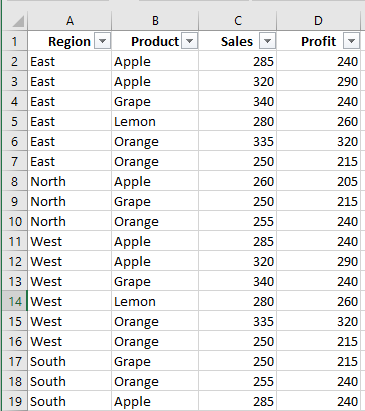
The Excel Subtotal feature requires the source data to be properly sorted and free of blank rows.
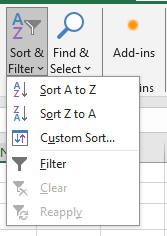
So before adding subtotals, make sure to sort the column by which you want to group your data. The easiest way is to click the Filter button on the Data tab, then click the filter arrow and choose Sort A to Z or Sort Z to A:
Add Subtotals
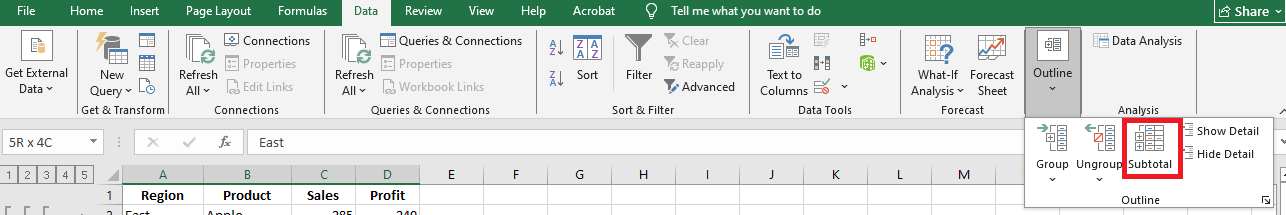
Select any cell in your dataset, go to the Data tab > Outline group, then click Subtotal.
Tip: To subtotal only part of your data, select the desired range before clicking the Subtotal button.
Define Subtotal Options
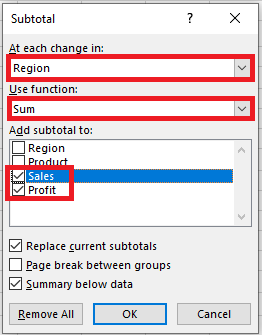
In the Subtotal dialog box, specify the three main elements — which column to group by, which summary function to use, and which columns to subtotal:
- In the At each change in box, select the column that contains the group data.
- In the Use function box, select one of the following:
- Sum – Adds the numbers
- Count – Counts non-empty cells (uses COUNTA)
- Average – Calculates the mean
- Max – Returns the largest value
- Min – Returns the smallest value
- Product – Multiplies the numbers
- Count Numbers – Counts only numeric cells (uses COUNT)
- StDev – Estimates standard deviation (sample)
- StDevP – Standard deviation (population)
- Var – Estimates variance (sample)
- VarP – Variance (population)
- Under Add subtotal to, check the columns you want to subtotal.
In this example, we group by the Region column and use the SUM function to total the Sales and Profit columns:
You can also choose:
- Page break between groups – Inserts a page break after each subtotal.
- Summary below data – Uncheck to show the summary row above the data.
- Replace current subtotals – Leave checked to overwrite existing ones.
Click OK. Subtotals will appear below each group and a grand total at the bottom.
Once inserted, subtotals are recalculated automatically when source data changes.
Tip: If subtotals are not updating, check File > Options > Formulas > Workbook Calculation and make sure it’s set to Automatic.
Things to Know About Excel Subtotals
The Excel Subtotal feature is powerful and flexible, but also has specific behaviors. Here’s what you need to know:
Only Visible Rows Are Subtotaled
Excel Subtotal only calculates visible cells and ignores filtered-out rows. However, it does include manually hidden rows (e.g., hidden via Home > Format > Hide & Unhide, or right-click > Hide).
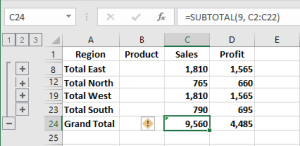
It uses the SUBTOTAL function, which includes a function number as its first argument. There are two sets:
- 1–11: Ignores filtered-out cells but includes manually hidden rows.
- 101–111: Ignores both filtered and manually hidden rows.
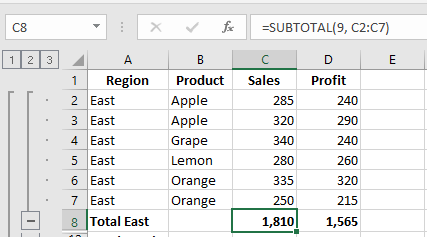
By default, Excel uses 1–11. For example, using SUM, it will insert:
=SUBTOTAL(9, C2:C7), where 9 means SUM.
To ignore manually hidden rows, change the formula to:
=SUBTOTAL(109, C2:C7), where 109 means SUM (ignoring all hidden rows).
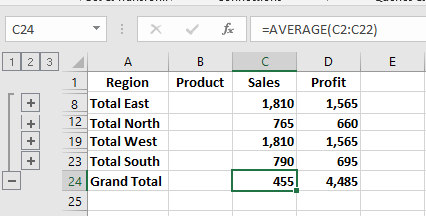
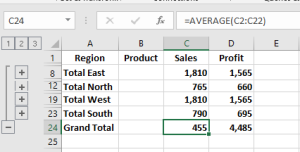
Grand Totals Are Based on Original Data
Grand totals are calculated from raw data, not from subtotal values.
For example, if you use AVERAGE, Excel calculates the grand average from all values in C2:C19, not the subtotal rows.
Subtotals Aren’t Available in Excel Tables
If the Subtotal button is grayed out, you’re likely working with an Excel Table. Subtotals don’t work with tables — convert it to a normal range first.
Adding Multiple (Nested) Subtotals
Let’s now add nested subtotals — for instance, grouping first by Region, then by Item.
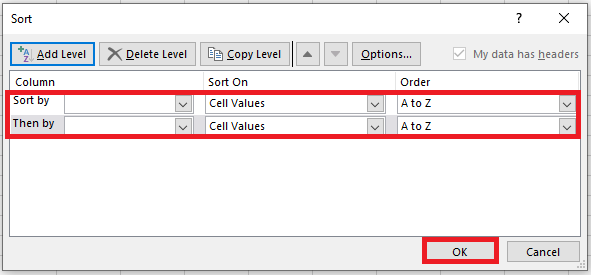
Sort Data by Multiple Columns
Go to Data > Sort, and add multiple sort levels (e.g., by Region, then Item).
Insert First-Level Subtotals
Select a cell and add the outer subtotal (e.g., by Region as done before).
Add Nested Subtotals
Click Data > Subtotal again:
- In At each change in, select the second column (e.g., Item)
- Select a function (e.g., SUM)
- Choose the same or different subtotal columns
- Important: Uncheck Replace current subtotals
Repeat to add more nested subtotals.


Add Different Subtotals for the Same Column
You can apply more than one function to the same column. For example, in addition to the SUM, add AVERAGE for Sales and Profit:
Just follow the steps for adding multiple subtotals and uncheck Replace current subtotals each time.
How to Use Excel Subtotals Effectively
Show or Hide Subtotal Details
Click the outline symbols in the upper-left corner:
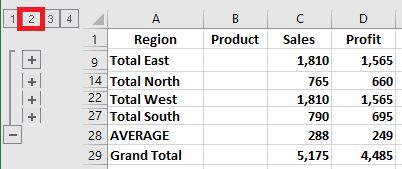
- 1 shows only grand totals
- Highest number shows all details
- Intermediate numbers show partial groupings
E.g., click 2 to show grouping by Region:
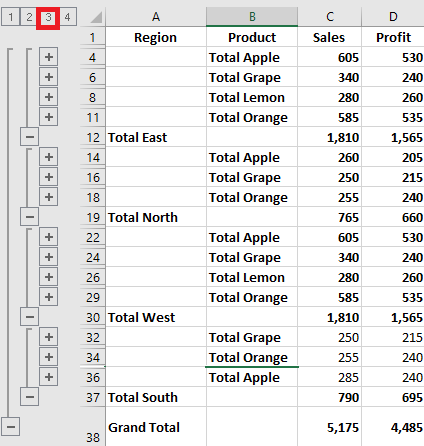
Click 3 to show nested subtotals by Item:
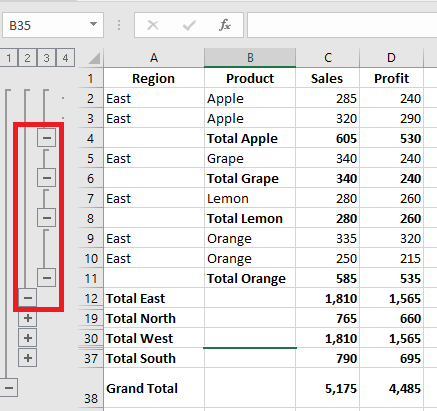
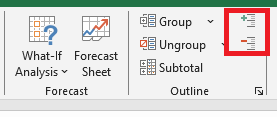
To expand/collapse individual groups, click + / – or use Show/Hide Detail on the Data tab:
Copy Only Subtotal Rows
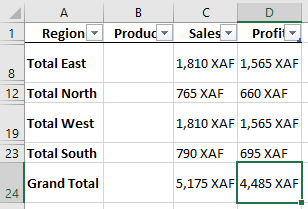
To copy just the visible subtotal rows (not all rows):
- Collapse the outline to display only subtotals
- Select any subtotal cell and press Ctrl + A
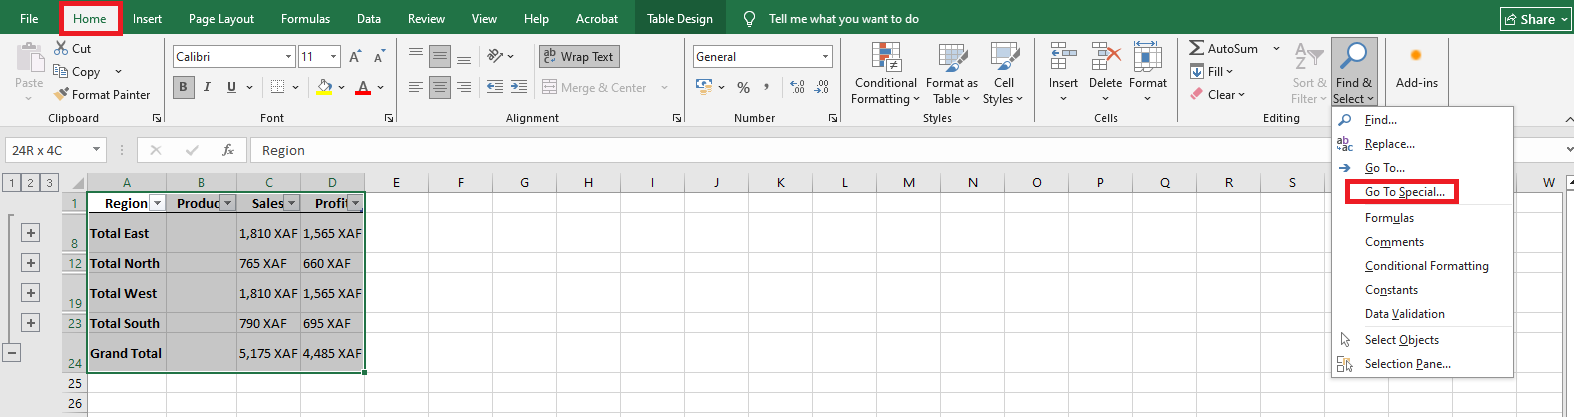
- Go to Home > Find & Select > Go To Special
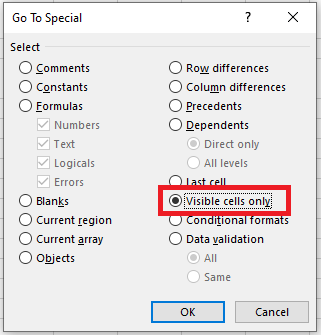
- In the dialog, choose Visible cells only
- Press Ctrl + C to copy, then Ctrl + V to paste elsewhere
This will paste only the subtotal values, not the formulas.
Tip: Use the same method to format all subtotal rows at once.
Modify Existing Subtotals
To quickly change existing subtotals:
- Select a subtotal cell
- Go to Data > Subtotal
- Change the grouping column, summary function, or subtotal columns
- Ensure Replace current subtotals is checked
- Click OK
Note: If multiple subtotals exist for the same data, you must first remove all subtotals and recreate them.
How to Remove Subtotals in Excel
To remove all subtotals:
- Select any cell in the subtotal range
- Go to Data > Outline > Subtotal
- In the dialog box, click Remove All
Besides Excel’s built-in Subtotal tool, there’s also a manual way to add subtotals — by using the SUBTOTAL() function directly. This method offers even more flexibility, and we’ll show you some helpful tricks in the next tutorial