To visualize numeric data in Microsoft Excel, there is a wide range of chart types available:
■ Charts
■ Shapes
■ WordArt
■ Conditional Formatting
■ Sparklines
■ SmartArt
Charts can be quickly generated in Excel by simply pressing a button. In this chapter, you’ll learn how to create and modify charts using VBA code. This enables you to use your programming skills to create customized charts.
Naturally, to build a chart, you must first prepare a data range, determine the chart type, consider the elements to display, etc. This chapter demonstrates how to use the Chart and ChartObject objects, which allow you to automate chart creation and configuration.
What Should You Know About Charts?
In Excel, you can create two types of charts: embedded charts and chart sheets.
- Embedded charts appear on a worksheet alongside data and text—ideal for reports.
- Charts on chart sheets are better suited for slide presentations or printing.
Creating a chart takes just a click: select the prepared data, go to the Insert tab, and choose the chart type from the Charts group. By default, the chart appears next to the data.
About the ChartObjects and Charts Collections, ChartObject and Chart
In VBA, the Sheets collection includes two subcollections:
Worksheets: regular worksheetsCharts: chart sheets only
Charts embedded in worksheets belong to the ChartObjects collection. Charts on dedicated chart sheets belong to the Charts collection. So:
ChartObject→ embedded in a WorksheetChart→ embedded in a Workbook
Both Workbook and Application objects have an ActiveChart property that returns the currently active chart.
Table: Sub-objects of the Chart Object
| Object | Description |
|---|---|
| ChartArea | The area where the entire chart is drawn |
| PlotArea | The area where the data series are plotted |
| Floor | Horizontal plane of a 3D chart |
| Walls (BackWall…) | Vertical planes of a 3D chart |
| Corners | Corners of a 3D chart |
| PageSetup | Page layout settings |
| ChartTitle | Title of the chart |
| SeriesCollection | Data series along the Y-axis |
| Trendlines | Trendlines |
| Axis | Axes |
| AxisTitle | Axis titles |
| DisplayUnitLabel | Axis unit scaling |
| Gridlines | Coordinate gridlines |
| TickLabels | Axis tick labels |
| DataTable | Data table for the chart |
| Legend | Chart legend |
| Shapes | Plotting area shapes |
| DataLabels | Data value labels |
| Points | Data points in a series |
Adding Items to ChartObjects and Charts Collections
Both collections support:
Add: add a new chartDelete: remove a chartCount: number of charts
ChartObjects.Add(left, top, width, height)
- All parameters are optional.
- Defines the location and size of an embedded chart on the worksheet.
Charts.Add(before, after, count)
- All parameters are optional.
- Specifies where to insert a chart sheet in the workbook.
Key Properties of the Chart Object
| Property | Description |
|---|---|
| Area3DGroup | Info on the 3D area of the chart |
| AutoScaling | Enables auto-scaling in 3D charts |
| Bar3DGroup | Info on 3D bar chart |
| ChartArea | Chart area object |
| ChartTitle | Chart title object |
| ChartType | Chart type (e.g., xlLine, xlPie) |
| Column3DGroup | Info on 3D column chart |
| Corners | Chart corners |
| DataTable | Data table object |
| DepthPercent | 3D chart depth |
| DisplayBlanksAs | How to treat empty cells (xlZero, xlInterpolated, xlNotPlotted) |
| Elevation | 3D chart elevation angle |
| Floor | Floor object for 3D charts |
| GapDepth | Space between bars in 3D chart |
| HasAxis | Whether axes are shown |
| HasDataTable | Whether chart includes a data table |
| HasLegend | Whether chart has a legend |
| HasTitle | Whether chart has a title |
| HeightPercent | Height as a percent of width |
| Hyperlinks | Hyperlinks collection |
| Index | Chart index in Charts collection |
| Legend | Legend object |
| PageSetup | Page layout object |
| Perspective | Perspective angle for 3D chart |
| PlotArea | Plot area object |
| PlotBy | Plot by xlRows or xlColumns |
| PlotVisibleOnly | Whether hidden cells are ignored |
| Protection properties | (e.g., ProtectContents, ProtectFormatting) defines protection level |
| Rotation | 3D rotation angle |
| Visible | Visibility of the chart |
| Walls | Walls object |
ChartType Values
| Chart Type | Constants |
|---|---|
| Column | xlColumnClustered, xl3DColumnClustered, etc. |
| Bar | xlBarClustered, xlBarStacked, etc. |
| Line | xlLine, xlLineMarkers, xl3DLine, etc. |
| Pie | xlPie, xl3DPie, xlPieOfPie, etc. |
| XY (Scatter) | xlXYScatter, xlXYScatterSmooth, etc. |
| Area | xlArea, xl3DArea, xlAreaStacked, etc. |
| Doughnut | xlDoughnut, xlDoughnutExploded |
| Radar | xlRadar, xlRadarMarkers, xlRadarFilled |
| Surface | xlSurface, xlSurfaceTopView, etc. |
| Bubble | xlBubble, xlBubble3DEffect |
| Stock | xlStockHLC, xlStockOHLC, etc. |
| Cylinder | xlCylinderColClustered, xlCylinderBarStacked, etc. |
| Cone | xlConeColClustered, xlConeBarStacked, etc. |
| Pyramid | xlPyramidColClustered, xlPyramidBarStacked, etc. |
Chart Object Methods
| Method | Description |
|---|---|
Activate |
Activates the chart |
ApplyDataLabels |
Applies data labels |
AutoFormat |
Applies automatic formatting |
Axes |
Returns the Axes collection |
ChartObjects |
Returns the ChartObjects collection |
ChartWizard |
Builds a chart with a wizard |
CheckSpelling |
Performs spell check |
Copy |
Copies the chart |
CopyPicture |
Copies the chart as a picture |
Delete |
Deletes the chart |
Deselect |
Deselects the chart |
Export |
Exports the chart as a graphic file |
GetChartElement |
Gets element info at specified coordinates |
Location |
Sets or returns the chart’s location |
Move |
Moves the chart |
Paste |
Pastes clipboard content to the chart |
PrintOut |
Prints the chart |
SendToBack |
Sends the chart to back |
Protect |
Sets protection options |
Refresh |
Refreshes the chart |
SaveAs |
Saves chart as new file |
Select |
Selects the chart |
SeriesCollection |
Returns the data series collection |
SetBackgroundPicture |
Sets chart background image |
SetSourceData |
Defines the data range for the chart |
Unprotect |
Removes chart protection |
Chart Object Events
| Event | Description |
|---|---|
Activate |
When the chart is activated |
BeforeDoubleClick |
Before double-clicking the chart |
BeforeRightClick |
Before right-clicking the chart |
Calculate |
When chart data changes |
Deactivate |
When the chart is deactivated |
DragOver |
While dragging a range over the chart |
DragPlot |
While dragging a range into the chart |
MouseDown, MouseUp |
When mouse button is pressed/released |
MouseMove |
When the mouse moves over the chart |
Resize |
When the chart is resized |
Select |
When a chart element is selected |
SeriesChange |
When hovering over a data series |
Creating a Chart
Creating a Simple Chart
You can create a chart on a dedicated chart sheet or embed it in a worksheet. Both are covered below.

Creating a Chart Sheet
Sub CreateChartSheet()
    ThisWorkbook.Charts.Add After:=Worksheets("Sheet1")
    With ActiveChart
        .ChartType = xlLine
        .SetSourceData Worksheets("Sheet1").Range("A1:C11")
        .Name = "Chart1"
    End With
End Sub
Comments:
Charts.Addcreates a new chart sheet.ChartTypesets the chart type (here: line chart).SetSourceDatasets the data range for the chart.Nameassigns a name to the chart.
Note: SetSourceData also accepts a second argument to specify whether data is plotted by rows or columns: xlColumns (default) or xlRows.
Creating an Embedded Chart
Sub CreateEmbeddedChart()
    Dim ChartFrame As ChartObject
    Dim RealChart As Chart

    Set ChartFrame = ThisWorkbook.Worksheets("Sheet1") _
        .ChartObjects.Add(250, 15, 300, 150)
    Set RealChart = ChartFrame.Chart
    RealChart.ChartType = xlLine
    RealChart.SetSourceData Worksheets("Sheet1").Range("A1:C11")
End Sub
Comments:
ChartObjects.Add(left, top, width, height)creates an embedded chart.ChartObjectholds the frame;.Chartgives access to the actual chart.ChartTypeandSetSourceDatawork just like with chart sheets.
Customizing a Chart
You can modify many properties depending on the chart type.
Customize the Chart Sheet
Sub CustomizeChartSheet()
    Dim RealChart As Chart
    Set RealChart = ThisWorkbook.Charts(1)
    CustomizeChart RealChart
End Sub
Comments
The program is divided into two parts. First, the part that applies only to chart sheets:
- A variable of type
Chartis declared. - The first chart sheet in the workbook is assigned to it.
- The
CustomizeChartprocedure is called, and the chart is passed as a parameter.
Sub CustomizeChart (RealChart As Chart)
Sub CustomizeChart(RealChart As Chart)
' Chart Area
RealChart.ChartArea.Interior.Color = vbCyan
' Plot Area
RealChart.PlotArea.Interior.Color = vbYellow
' Title
RealChart.HasTitle = True
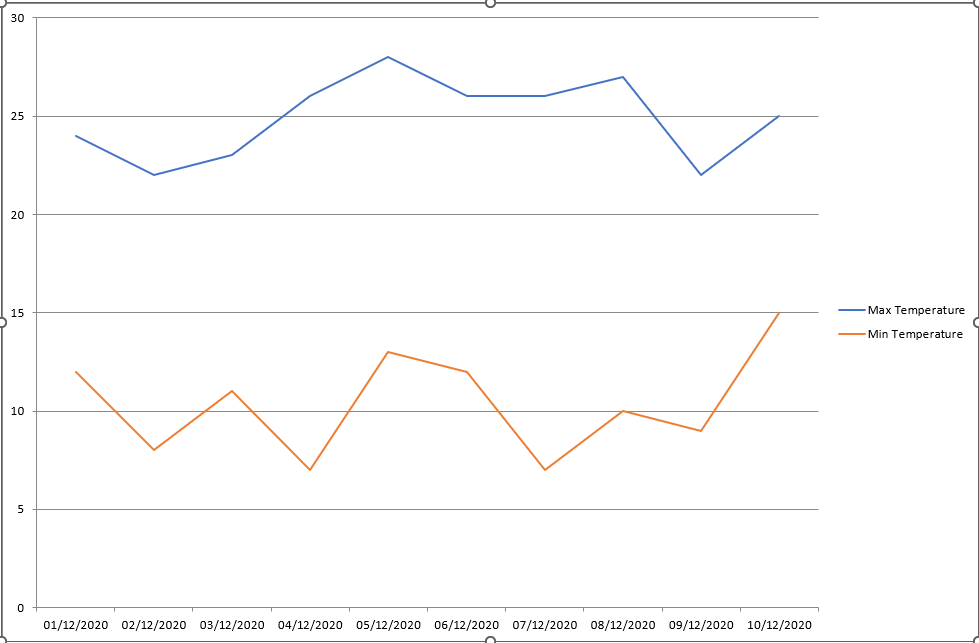
RealChart.ChartTitle.Text = "Temperature"
' Legend
RealChart.HasLegend = True
With RealChart.Legend
.Interior.Color = vbYellow
.Border.Color = vbBlue
.Border.Weight = xlThick
End With
' Category Axis
With RealChart.Axes(xlCategory)
.HasTitle = True
.AxisTitle.Text = " Date "
.TickLabels.NumberFormatLocal = "DD.MM."
End With
' Value Axis
With RealChart.Axes(xlValue)
.HasTitle = True
.AxisTitle.Text = " Degree"
.MinimumScale = 5
.MaximumScale = 35
End With
' Data Series
With RealChart.SeriesCollection(1)
.Border.Color = vbRed
.MarkerStyle = xlMarkerStyleCircle
.MarkerForegroundColor = vbRed
.MarkerBackgroundColor = vbRed
End With
' Data Point
With RealChart.SeriesCollection(1).Points(3)
.Border.Color = vbBlue
.ApplyDataLabels xlShowValue
.MarkerStyle = xlMarkerStyleSquare
.MarkerForegroundColor = vbBlue
.MarkerBackgroundColor = vbBlue
End With
End Sub
Comments
- The
ChartAreaproperty represents the entire chart area (plot, title, legend). - The
Interior.Colorproperty sets the fill color. PlotArearepresents the data plotting area. It also supports color fill.- The chart title is activated with
HasTitle = True. ChartTitle.Textsets the title string.Legendis controlled viaHasLegend. You can style its interior and border.- All axes are listed in
Axes.xlCategory: horizontal axisxlValue: vertical axis
AxisTitle.Textdefines the title for each axis.TickLabels.NumberFormatLocalsets the format (e.g. for dates).MinimumScaleandMaximumScaleadjust the axis scale range.SeriesCollection(1)accesses the first data series:- You can style its border and marker (color, shape).
Points(3)accesses the third data point in the series:- Its appearance and label are customized.
ApplyDataLabels xlShowValuedisplays value labels.- Valid constants for marker styles include:
xlMarkerStyleCircle,xlMarkerStyleSquare,xlMarkerStyleNone.
Customize an Embedded Chart
Sub CustomizeEmbeddedChart()
    Dim CO As ChartObject
    Dim CH As Chart

    Set CO = ThisWorkbook.Worksheets("Sheet1").ChartObjects(1)
    CO.Left = 180
    CO.Top = 25
    CO.Width = 390
    CO.Height = 250

    Set CH = CO.Chart
    CustomizeChart CH
End Sub
Comments
- Variables
COandCHare declared asChartObjectandChart. - For embedded charts, you can adjust position and size using:
Left,Top,Width,Height
- The known
CustomizeChartprocedure is called to apply styling.