
The median is one of the three main measures of central tendency, widely used in statistics to identify the center point of a dataset or population. It provides a useful summary when analyzing values such as typical salaries, household incomes, property prices, land taxes, and other economic indicators.
What is the Median?
Simply put, the median represents the middle value in a sorted set of numbers. It divides the dataset into two equal halves — one containing values lower than the median and the other containing values higher than the median.
When the dataset contains an odd number of elements, the median is the middle value. However, when the dataset has an even number of elements, the median is calculated as the average of the two middle values.
For example:
- In the dataset {1, 2, 3, 4, 7}, which contains five elements, the median is 3, because it is the third and central value in the ordered list.
- In the dataset {1, 2, 2, 3, 4, 7}, which has six elements, the two middle values are 2 and 3, so the median is their average: (2 + 3) / 2 = 2.5.
I
Unlike the arithmetic mean (average), the median is much less affected by outliers—values that are significantly higher or lower than the rest of the data. This makes the median the preferred measure of central tendency when dealing with skewed distributions or datasets with extreme values.
A classic example is median salary. It provides a more accurate picture of what most people earn compared to the average salary, which can be misleading if a small number of individuals earn exceptionally high or low salaries. In such cases, the average can be heavily distorted, while the median remains a more reliable indicator of the typical income.
The MEDIAN Function in Excel
Microsoft Excel includes a built-in function called MEDIAN to calculate the median of a set of numeric values efficiently. The syntax of the MEDIAN function is as follows:
=MEDIAN(number1, [number2], …)
- number1, number2, … are the numeric values or references for which you want to find the median.
- These can be hardcoded numbers, dates, named ranges, arrays, or cell references containing numbers.
- The first argument (number1) is required, while the remaining arguments are optional.
In Excel 2007 and later versions (including Excel 2010, 2013, 2016, and beyond), the MEDIAN function supports up to 255 arguments. In older versions like Excel 2003 and earlier, it can handle up to 30 arguments.
Four Key Facts About the MEDIAN Function
Here are four important behaviors to understand when using the MEDIAN function:
- Odd vs Even Count: If the number of values is odd, the function returns the middle value. If the number is even, it returns the average of the two middle values.
- Zero Values: Cells containing the number 0 are included in the calculation.
- Empty and Non-Numeric Cells: Blank cells, cells with text, or cells containing logical values like TRUE or FALSE (when referenced via a range) are ignored.
- Logical Values in Arguments: If logical values (TRUE or FALSE) are entered directly as arguments, they are included. For example:
=MEDIAN(FALSE, TRUE, 2, 3, 4)
Excel interprets FALSE as 0 and TRUE as 1, so the dataset becomes {0, 1, 2, 3, 4}. The median is 2.
How to Calculate the Median in Excel: Formula Examples
The MEDIAN function is one of the simplest and most user-friendly statistical functions in Excel. Still, there are some useful tricks that beginners may not immediately discover—such as calculating the median based on a condition (which will be covered in more advanced examples).
Let’s start with the basic use of the function. Suppose you have a sales report and want to find the median of the sales values in cells C2 to C8. You can use the following straightforward formula:
=MEDIAN(C2:C10)
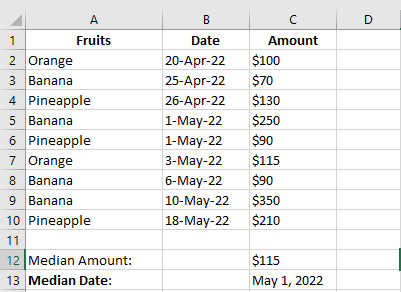
As demonstrated in the screenshot above, the MEDIAN function works seamlessly with both numbers and dates, since Excel internally treats dates as serial numbers. This means that you can calculate the median of a set of dates in the same way you would for numerical values.
Conditional Median Formula Based on a Single Criterion
Unfortunately, Microsoft Excel does not offer a built-in function to calculate a conditional median (like it does for the average using AVERAGEIF() or AVERAGEIFS()). However, you can easily create your own custom array formula to perform this calculation.
The general structure of the conditional median formula is:
=MEDIAN(IF(criteria_range = criteria_value, median_range))
Example:
Suppose you have a table with the following columns:
- Column A: Item Name
- Column C: Amount
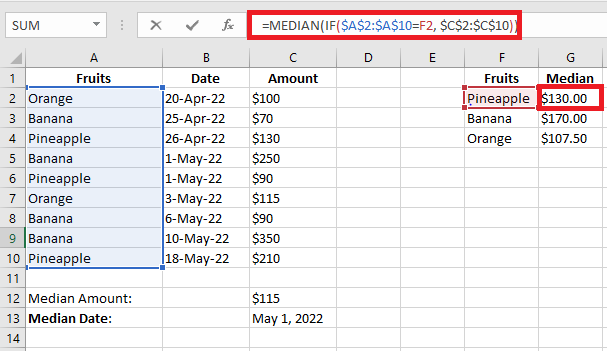
To calculate the median amount for a specific item (e.g., « Apples »), first enter the item name (e.g., « Apples ») in a cell, say E2, and then use the following formula:
=MEDIAN(IF($A$2:$A$10 = $E$2, $C$2:$C$10))
This formula tells Excel to:
- Look at all the values in Column A (items) from cells A2 to A10.
- Compare each one with the value in cell E2 (e.g., « Apples »).
- Only if there is a match, include the corresponding value from Column C (amount) in the median calculation.
Important Notes:
- The dollar signs (
$) are used to make the cell references absolute, so they don’t change when you copy the formula to other cells. - Because the
IF()function returns an array, this formula must be entered as an array formula in Excel versions prior to Office 365 or Excel 2021.
To do this:- Press Ctrl + Shift + Enter instead of just Enter.
- If done correctly, Excel will display the formula enclosed in curly braces
{}like this:
In Excel 365 and Excel 2021 (with dynamic arrays), pressing just Enter is sufficient.
Conditional Median Formula Based on Multiple Criteria
To take the previous example a step further, suppose you add an additional column to your dataset, such as Order Status. You now want to calculate the median amount for each item, but only for orders that match a specific status (e.g., « Completed »).
In other words, we are calculating the median based on two conditions:
-
The Item Name
-
The Order Status
Since Excel does not offer a built-in MEDIANIFS() function, you can use nested IF statements inside the MEDIAN function to simulate this behavior.
General Formula Syntax:
=MEDIAN(IF(criteria_range1 = criteria1, IF(criteria_range2 = criteria2, median_range)))
This structure allows you to filter the data by multiple conditions before calculating the median.
Example:
Assume your table contains the following columns:
-
Column A: Item Names (e.g., « Apple », « Banana »)
-
Column C: Order Amounts
-
Column D: Order Status (e.g., « Pending », « Completed »)
Now, to calculate the median for a given item and status:
-
Enter the item name in cell F2 (e.g., « Apple »)
-
Enter the order status in cell G2 (e.g., « Completed »)
Then use the following formula:
=MEDIAN(IF($A$2:$A$10 = $F2, IF($D$2:$D$10 = $G2, $C$2:$C$10)))
Important Notes:
-
This is an array formula, so in older versions of Excel (prior to Excel 365 or Excel 2021), you must confirm it by pressing Ctrl + Shift + Enter instead of just Enter.
- If done correctly, Excel will display the formula wrapped in curly braces:
{=MEDIAN(IF($A$2:$A$10 = $F2, IF($D$2:$D$10 = $G2, $C$2:$C$10)))}
-
In Excel 365 and later, you can simply press Enter thanks to dynamic array support.
This method enables you to compute the conditional median with multiple criteria, which is especially useful in complex datasets—for example, calculating the median value of all « Banana » orders that are currently « Completed », excluding all others
Median vs Mean: Which Is the Best Measure?
Generally, there is no “best” measure of central tendency. The measure to use mainly depends on the type of data you’re working with and your understanding of the « typical value » you’re trying to estimate.
- For a symmetric distribution (where values appear at regular frequencies), the mean, median, and mode are the same.
- For an asymmetric distribution (where there are a few extremely high or low values), these three measures can be different.
Since the mean is heavily influenced by outliers (values that are significantly different from the rest of the data), the median is often the preferred measure for skewed distributions.
For example, the median is generally considered a better measure than the mean when calculating a « typical salary. » Why? The best way to understand this would be through an example. Let’s consider the following salaries for common jobs:
- Electrician – $20/hour
- Nurse – $26/hour
- Police Officer – $47/hour
- Sales Manager – $54/hour
- Manufacturing Engineer – $63/hour
Now, calculate the mean (average):
(20 + 26 + 47 + 54 + 63) / 5 = 42. So, the average salary is $42/hour. The median salary is $47/hour (the police officer earns this). So, half earn less and half earn more.
Now, let’s say we add a celebrity earning around $30 million a year, or about $14,500/hour. The new average salary becomes $2,451.67/hour, a salary that nobody earns! However, the median remains largely unchanged at $50.50/hour.
As you can see, the median provides a better idea of what people typically earn because it’s not so strongly affected by outliers like extremely high salaries.
Conclusion
That’s how you calculate the mean, median, and mode in Excel. I hope you find this useful for your data analysis tasks! Thank you for reading, and I look forward to seeing you on our blog next week!