In descriptive statistics, both the arithmetic mean (also called the average) and the standard deviation are closely related concepts. While most people understand the mean, the standard deviation is less understood.
What is Standard Deviation?
The standard deviation is a measure that indicates how much the values in a dataset deviate (spread out) from the mean. In other words, the standard deviation tells you whether your data points are close to the mean or if they vary significantly.
The purpose of the standard deviation is to help you understand if the mean truly represents a « typical » value. The closer the standard deviation is to zero, the less variability there is in the data, and the more reliable the mean is. A standard deviation of 0 means every value in the dataset is exactly equal to the mean. The higher the standard deviation, the more variation there is in the data, making the mean less precise.
To better understand how this works, consider the following data:
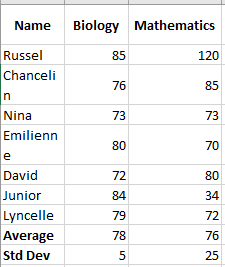
For biology, the standard deviation is 5 (rounded to the nearest whole number), indicating that most students’ scores are within 5 points of the average. Is this good? Yes, it shows that biology scores are quite consistent.
For mathematics, the standard deviation is 25. This indicates a significant spread in the scores, meaning some students achieved much better scores and/or some scored much lower than the average.
In practice, analysts often use standard deviation as a measure of investment risk— the higher the standard deviation, the higher the volatility of returns.
Standard Deviation of Sample and Population
When dealing with standard deviation, you may often hear the terms « sample » and « population, » referring to the completeness of the data you are working with. The main difference is:
- The population includes all elements of a dataset.
- The sample is a subset of data that includes one or more elements from the population.
Researchers and analysts deal with the standard deviation of a sample and a population in different situations. For instance, when summarizing the exam results of a class, a teacher would use the population’s standard deviation. Statisticians calculating the national average score would use a sample standard deviation since they are presented with data from a sample, not the entire population.
Understanding the Standard Deviation Formula
The reason the nature of the data is important is that the formulas for the standard deviation of a sample and a population are slightly different:
Sample Standard Deviation vs Population Standard Deviation
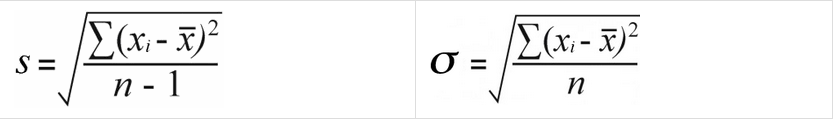
Where:
- xᵢ represents individual values in the dataset
- x is the mean of all the values
- n is the total number of values in the dataset
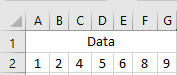
Having trouble understanding the formulas? Breaking them down into simple steps could help. But first, let’s take a look at some example data to work with:
Calculate the Mean (Average)
First, you calculate the mean of all the values in the dataset (x in the formulas above). To calculate manually, you add the numbers and divide the sum by the count of numbers:
(1 + 2 + 4 + 5 + 6 + 8 + 9) / 7 = 5
To find the average in Excel, use the AVERAGE() function, e.g., =AVERAGE(A2:G2).
For each number, subtract the mean and square the result.
This is the part of the standard deviation formula that says: (xᵢ – x)².
To visualize what happens, look at the following images.
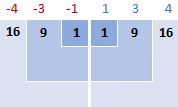
In this example, the mean is 5, so we calculate the difference between each data point and 5.
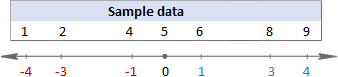
Then, square the differences, converting them all to positive numbers:
Sum the squared differences.
To say « sum up » in mathematics, you use sigma Σ. So, what we are doing now is summing up the squared differences to complete this part of the formula: Σ(xᵢ – x)².
16 + 9 + 1 + 1 + 9 + 16 = 52
Divide the total of squared differences by the number of values.
So far, the formulas for sample and population standard deviation are identical. At this point, they differ.
For the sample standard deviation, you obtain the sample variance by dividing the total of squared differences by the sample size minus 1:
52 / (7 – 1) = 8.67
For the population standard deviation, you calculate the average of the squared differences by dividing the total by the count of values:
52 / 7 = 7.43
Why this difference in the formulas?
Because in the sample standard deviation formula, you need to correct for the bias in estimating a sample mean instead of the true population mean. You do this by using n – 1 instead of n, known as Bessel’s correction.
Take the square root.
Finally, take the square root of the numbers above to get the standard deviation (rounded to 2 decimal places):
Sample Standard Deviation vs Population Standard Deviation
√8.67 = 2.94 vs √7.43 = 2.73
In Microsoft Excel, standard deviation is calculated the same way as in statistics, but all calculations are done in the background. The key for you is to choose the appropriate standard deviation function, which the next section will help you with.
How to Calculate Standard Deviation in Excel
Overall, there are six different functions to calculate standard deviation in Excel. Which one to use depends mainly on the nature of your data—whether you’re working with an entire population or a sample.
Functions to Calculate Sample Standard Deviation
To calculate standard deviation based on a sample, use one of the following formulas (all based on the “n-1” method described above):
STDEV( )
STDEV(number1, [number2], …) is the oldest Excel function to estimate the standard deviation based on a sample and is available in all Excel versions from 2003 to 2019.
In Excel 2007 and later, STDEV() can take up to 255 arguments including numbers, arrays, named ranges, or cell references. In Excel 2003, it accepts up to 30 arguments.
Logical values and text representations of numbers directly provided in the argument list are counted. Within arrays and references, only numbers are counted—blank cells, TRUE and FALSE values, text, and error values are ignored.
NOTE
The STDEV() function is obsolete and retained only for backward compatibility. Microsoft does not guarantee support in future versions. In Excel 2010 and later, it is recommended to use STDEV.S() instead.
STDEV.S( )
STDEV.S(number1, [number2], …) is an improved version of STDEV() introduced in Excel 2010.
Like STDEV(), it calculates sample standard deviation based on the classical formula mentioned above.
STDEVA( )
=STDEVA(value1, [value2], …) is another function to calculate sample standard deviation. It differs from the others in how it handles logical and text values:
- All logical values are included, whether in arrays, references, or direct input (
TRUE= 1,FALSE= 0). - Text values in arrays or references are counted as 0, including empty strings (
""), text representations of numbers, and any other text. Directly typed number-texts are counted as their numeric equivalents. - Blank cells are ignored.
NOTE
For a standard deviation formula to work properly, there must be at least two numeric values; otherwise, Excel returns a #DIV/0! error.
Functions to Calculate Population Standard Deviation
If you are working with the entire population, use one of the following functions, based on the “n” method:
STDEVP( )
STDEVP(number1, [number2], …) is the older Excel function for calculating population standard deviation.
In newer versions like Excel 2010, 2013, 2016, and 2019, it has been replaced by the improved STDEV.P(), but is still available for backward compatibility.
STDEV.P( )
=STDEV.P(number1, [number2], …) is the modern replacement for STDEVP(), providing improved accuracy. It’s available in Excel 2010 and later.
Like the sample functions, STDEVP() and STDEV.P() count only numeric values within arrays and references. However, in direct arguments, they also consider logical values and number-like texts.
STDEVPA( )
STDEVPA(value1, [value2], …) calculates population standard deviation, including text and logical values. It treats non-numeric values just like STDEVA() does.
NOTE
Regardless of the standard deviation function, Excel will return an error if an argument includes error values or text that cannot be interpreted as a number.
Which Standard Deviation Function to Use in Excel?
The abundance of standard deviation functions in Excel can be confusing, especially for beginners. To choose the correct formula, ask yourself these three questions:
- Are you calculating standard deviation for a sample or an entire population?
- Which version of Excel are you using?
- Does your dataset include only numbers, or also logical and text values?
Use:
STDEV.S()for sample standard deviation (Excel 2010+), orSTDEV()(Excel 2007 and earlier).STDEV.P()for population standard deviation (Excel 2010+), orSTDEVP()(Excel 2007 and earlier).STDEVA()andSTDEVPA()if your dataset includes logical/text values.
While STDEVA() and STDEVPA() are rarely used on their own, they can be useful in larger formulas where arguments are returned as text or logical values by other functions.
Standard Deviation Formula Examples
Once you’ve chosen the right function for your data, writing the formula is easy—the syntax is simple and self-explanatory. Here are some examples:
Calculating Standard Deviation for a Sample and Population
Depending on your data:
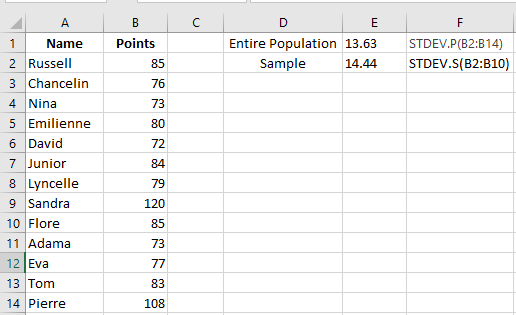
- To calculate standard deviation for the entire population (e.g., range B2:B14):
=STDEV.P(B2:B14)
- To calculate standard deviation for a sample (e.g., range B2:B10):
=STDEV.S(B2:B10)
As shown in the screenshot, the values will differ slightly (the smaller the sample, the larger the difference).
In Excel 2007 and earlier, use:
- Population:
=STDEVPA(B2:B14)
- Sample:
=STDEVA(B2:B10)
Calculating Standard Deviation for Text Representations of Numbers
Text representations of numbers are numbers formatted as text. These may come from:
- External sources
- Text functions like
TEXT(),MID(),RIGHT(),LEFT(), etc.
For example, if product codes like “Jeans-105” contain numeric values, you can extract them using:
=RIGHT(A2,LEN(A2)-FIND("-",A2,1))
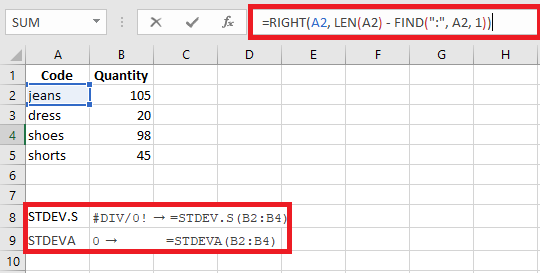
But if you try a standard deviation function on these extracted values, you might get #DIV/0! or 0 because Excel sees them as text.
To solve this, you can:
Use formulas like: =STDEV.S(RIGHT(A2,LEN(A2)-FIND("-",A2)), RIGHT(A3,...), ...)
Or
- Use
VALUE()(or--) to convert text to numbers:=STDEV.S(VALUE(RIGHT(A2,LEN(A2)-FIND("-",A2))), ...)
Or better yet, extract to a helper column and apply STDEV.S() to that column.
How to Calculate the Standard Error of the Mean
In statistics, the standard error of the mean (SEM) estimates how far the sample mean is from the true population mean. While standard deviation shows variability within data, SEM shows variability between sample means.
The formula is: SEM = SD / √n
Where:
- SD = sample standard deviation
- n = sample size
In Excel: =STDEV.S(range)/SQRT(COUNT(range))
Example: =STDEV.S(B2:B10)/SQRT(COUNT(B2:B10))
How to Add Standard Deviation Bars in Excel
To visually display standard deviation:
- Create your chart (Insert tab → Charts group).
- Click on the chart to select it, then click the Chart Elements button.
- Click the arrow next to Error Bars, then choose Standard Deviation.
This adds the same standard deviation bars for all data points.
This is how you calculate standard deviation in Excel.