The importance of the logarithmic scale
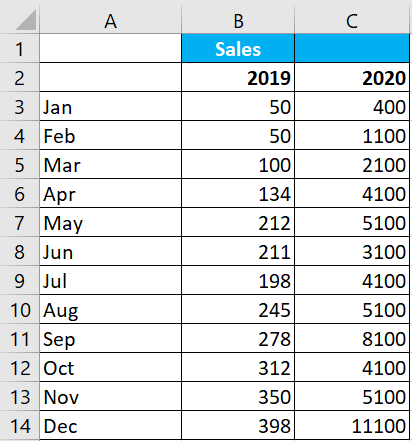
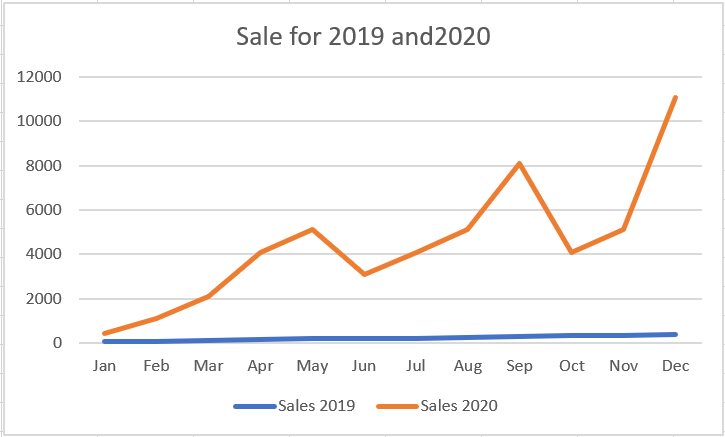
In some situations, your trends may start with very small numbers and end with very large numbers. In these cases, you end up with graphs that don’t accurately represent the actual trend. In the following figure, for example, you see the unit trends for 2019 and 2020. As you can see from the source data, 2019 started with a modest 50 units. As the months went by, the monthly unit count increased to 11,100 units by December 2010.
Because the two years are on different scales, it is difficult to discern a comparative trend for the two years.
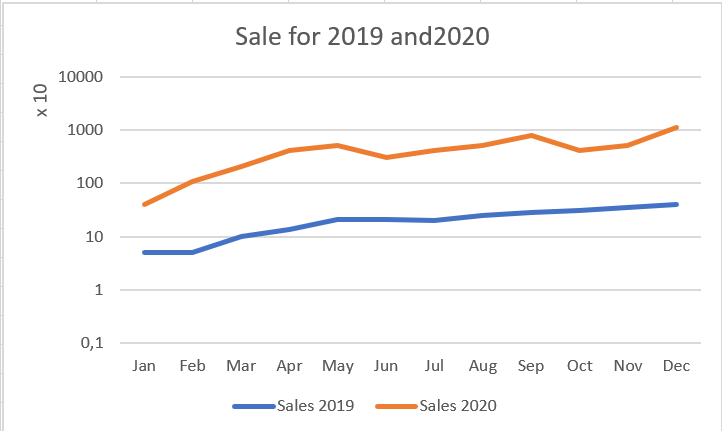
The solution is to use a logarithmic scale instead of a standard linear scale. A logarithmic scale allows the axis to jump from 1 to 10; to 100 to 1000; and so on without changing the spacing between the axis points. In other words, the distance between 1 and 10 is the same as the distance between 100 and 1000. The following figure shows the same graph as the previous figure, but on a logarithmic scale. Notice that the trends for both years are now clear and accurately represented.
To change the vertical axis of a chart to logarithmic scaling, follow these steps:
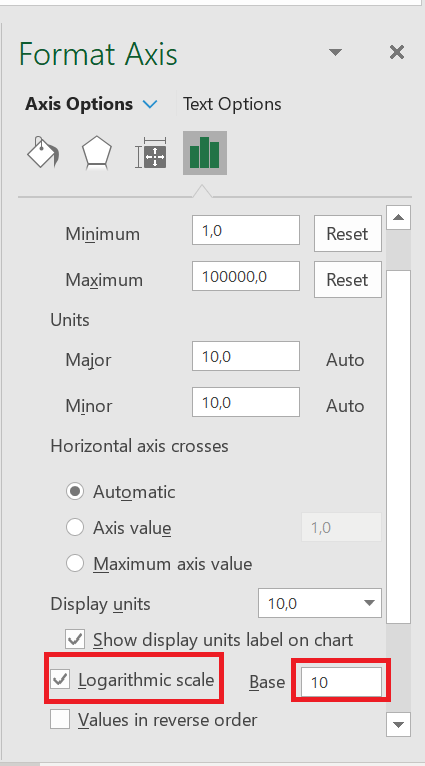
1. Right-click the vertical axis and choose Format Axis from the menu that appears. The
Format Axis dialog box appears.
2. Expand the Axis Options section and select the Logarithmic Scale check box , as shown in the following figure.
Logarithmic scales only work with positive numbers.